Originally posted by tx_ches
Al, I don't understand how you are trading your DBS. Wouldn't the goal be the ML which did not get met either yesterday or today? Are you trading the DBS as a failure?
Just seeking to understand what you are showing on the chart.
Originally posted by albert
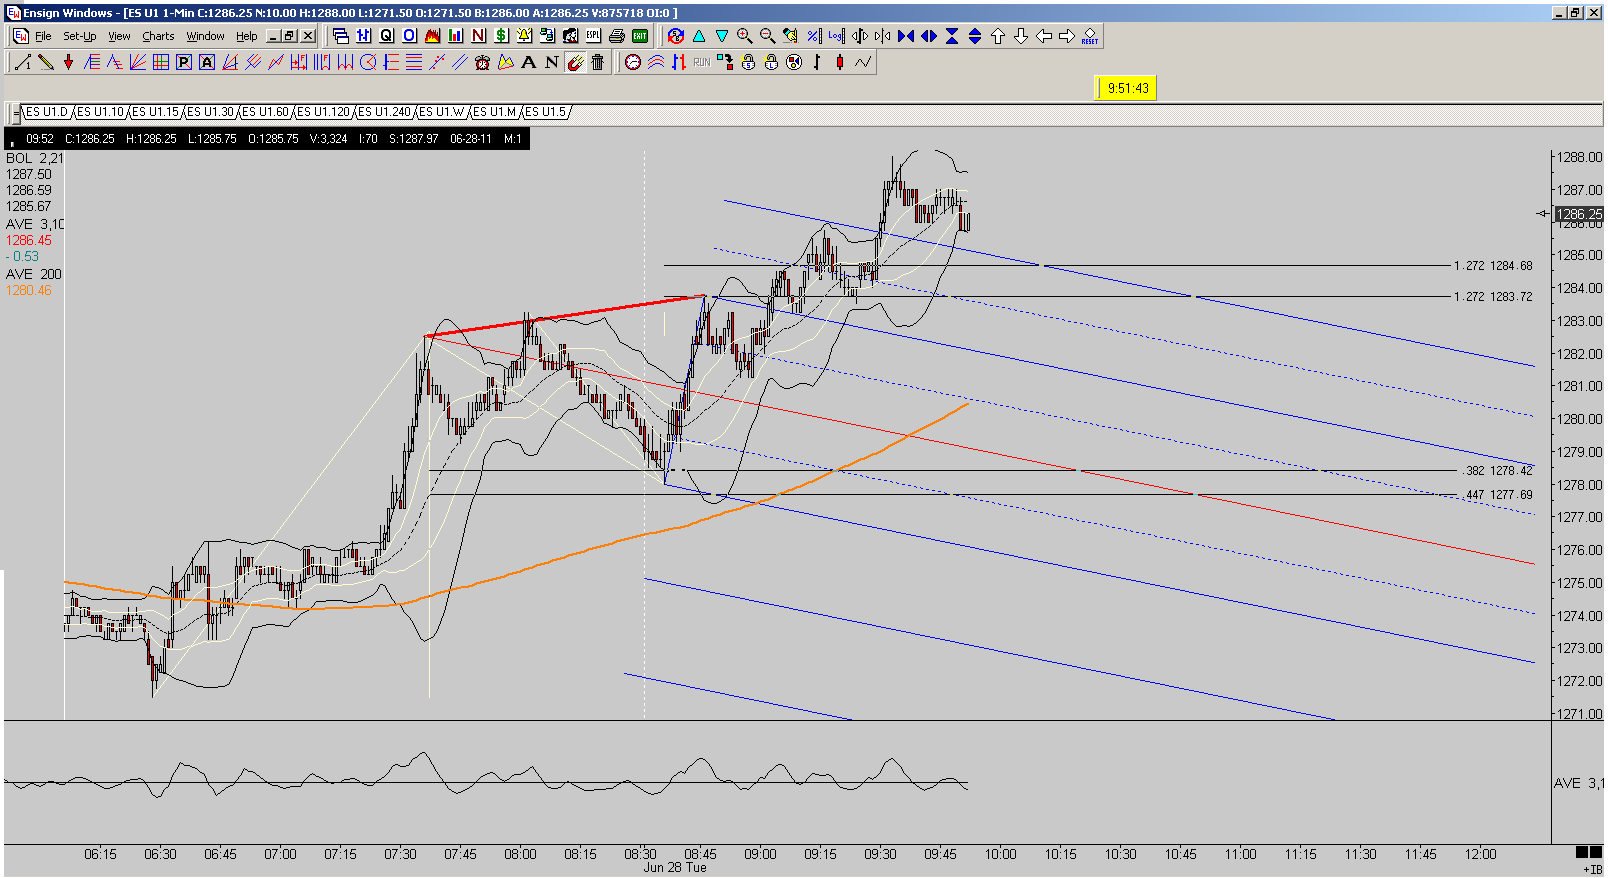
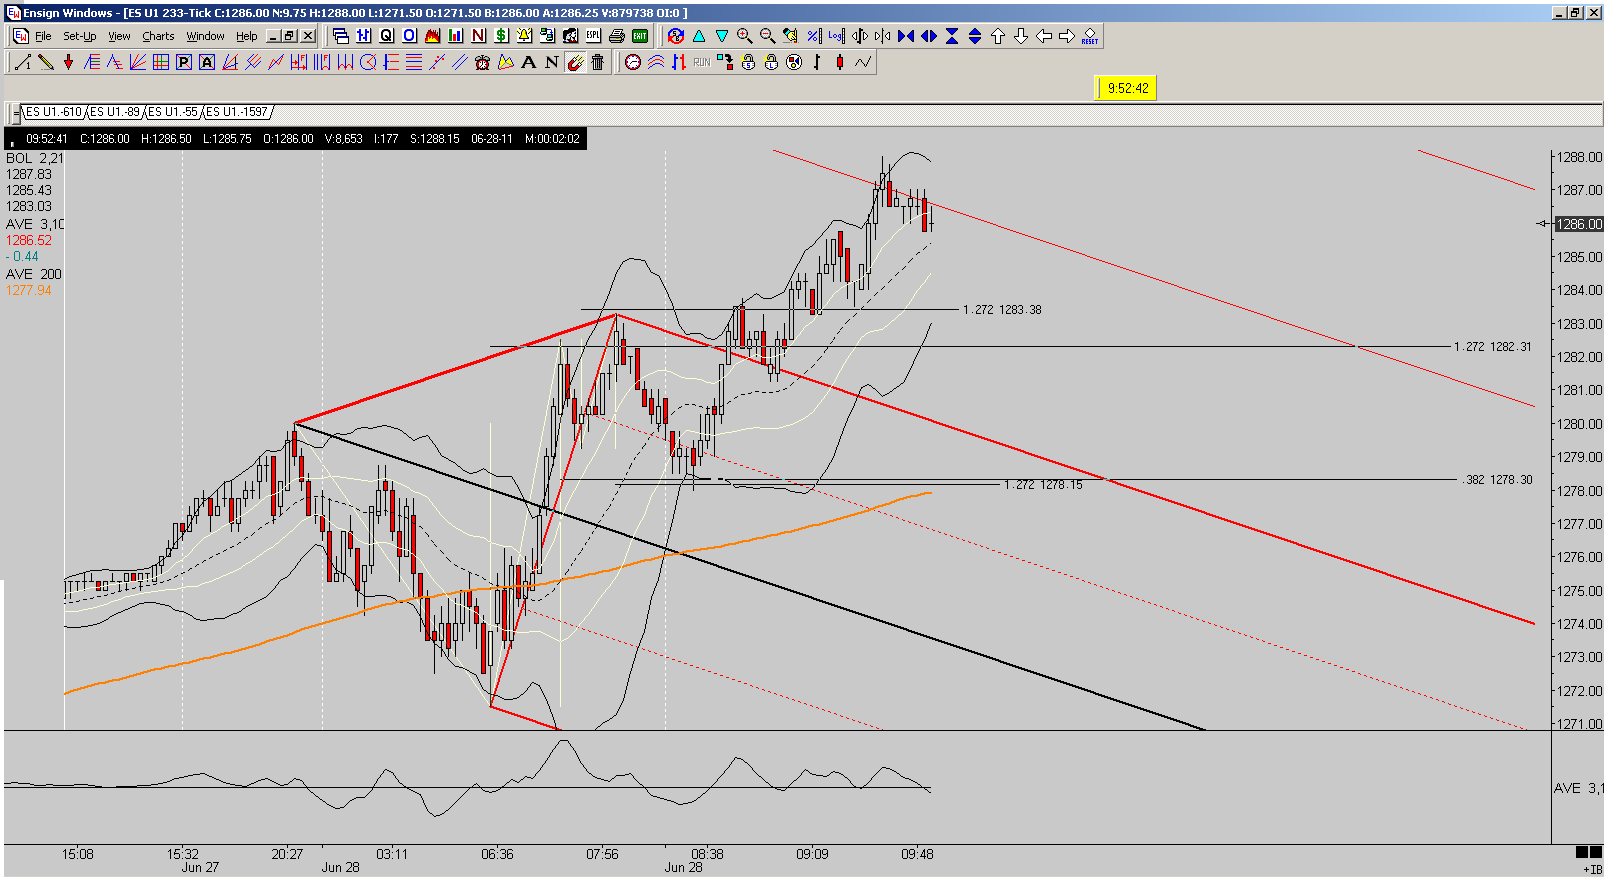
DBS and Kane EXP ABCD completing at 0.382 fibo. Nice. 1 min GLOBEX and a tick chart.
Al Kamego
Thanks, tx, for the excellent question and comments. Please let me try to explain. I do not trade everything I post, and I am still "simulation" trading the SPY, using the ES contract as a "proxy," on pretty small timeframes. I have the highest respect for roofer's techniques and statistics, they are some of the best I have ever seen. In this example, I simulation traded the Kane ABCD only on the 1 min GLOBEX chart. The DBS on the one minute was based on Kane ABCD points A and C. I am trying to improve my “trade management” by staying in successful trades longer. I generally exit successful trades way too quickly.
Anyway, I also try to never trade against a Kane ABCD, especially one that completes at a 0.382 fibo.
I look at “spike lines” or “simple lines” based on the Kane ABCD points and see them as possible S/R. to price progress. Price was looking strong when it completed the DBS, reacted to it (on the 1 min), and headed back up from near the DBS-based 25% division line/21 SMA confluence. For my own trading only, I am thinking DBSs are vulnerable to failure near the 25% division line. I have seen it a few times. Price dropped from the dbs endpoint to the 25% division line / 21 SMA confluence, acted strongly, so I stayed in the trade. I hope this is not too confusing. My goal is to stick longer with successful Kane ABCD trades, thru better trade management.
BTW, the dbs on the 1 minute chart is not the same as the dbs on the 233 tick chart, they are different. I thought that was worth a comparison. Probably too confusing, though. One last thing, 1 minute chart price drop to the DBS-based 25% division line/21 SMA confluence shows up on the 233 tick chart as a “zoom and retest” of the upper ML //. Pretty neat, I thought, after the smoke had cleared.
I hope this helps.
Good Trading,
Al Kamego