MyPivots
Sign In
JA
jarek
Rep: 94
Posts: 3,474
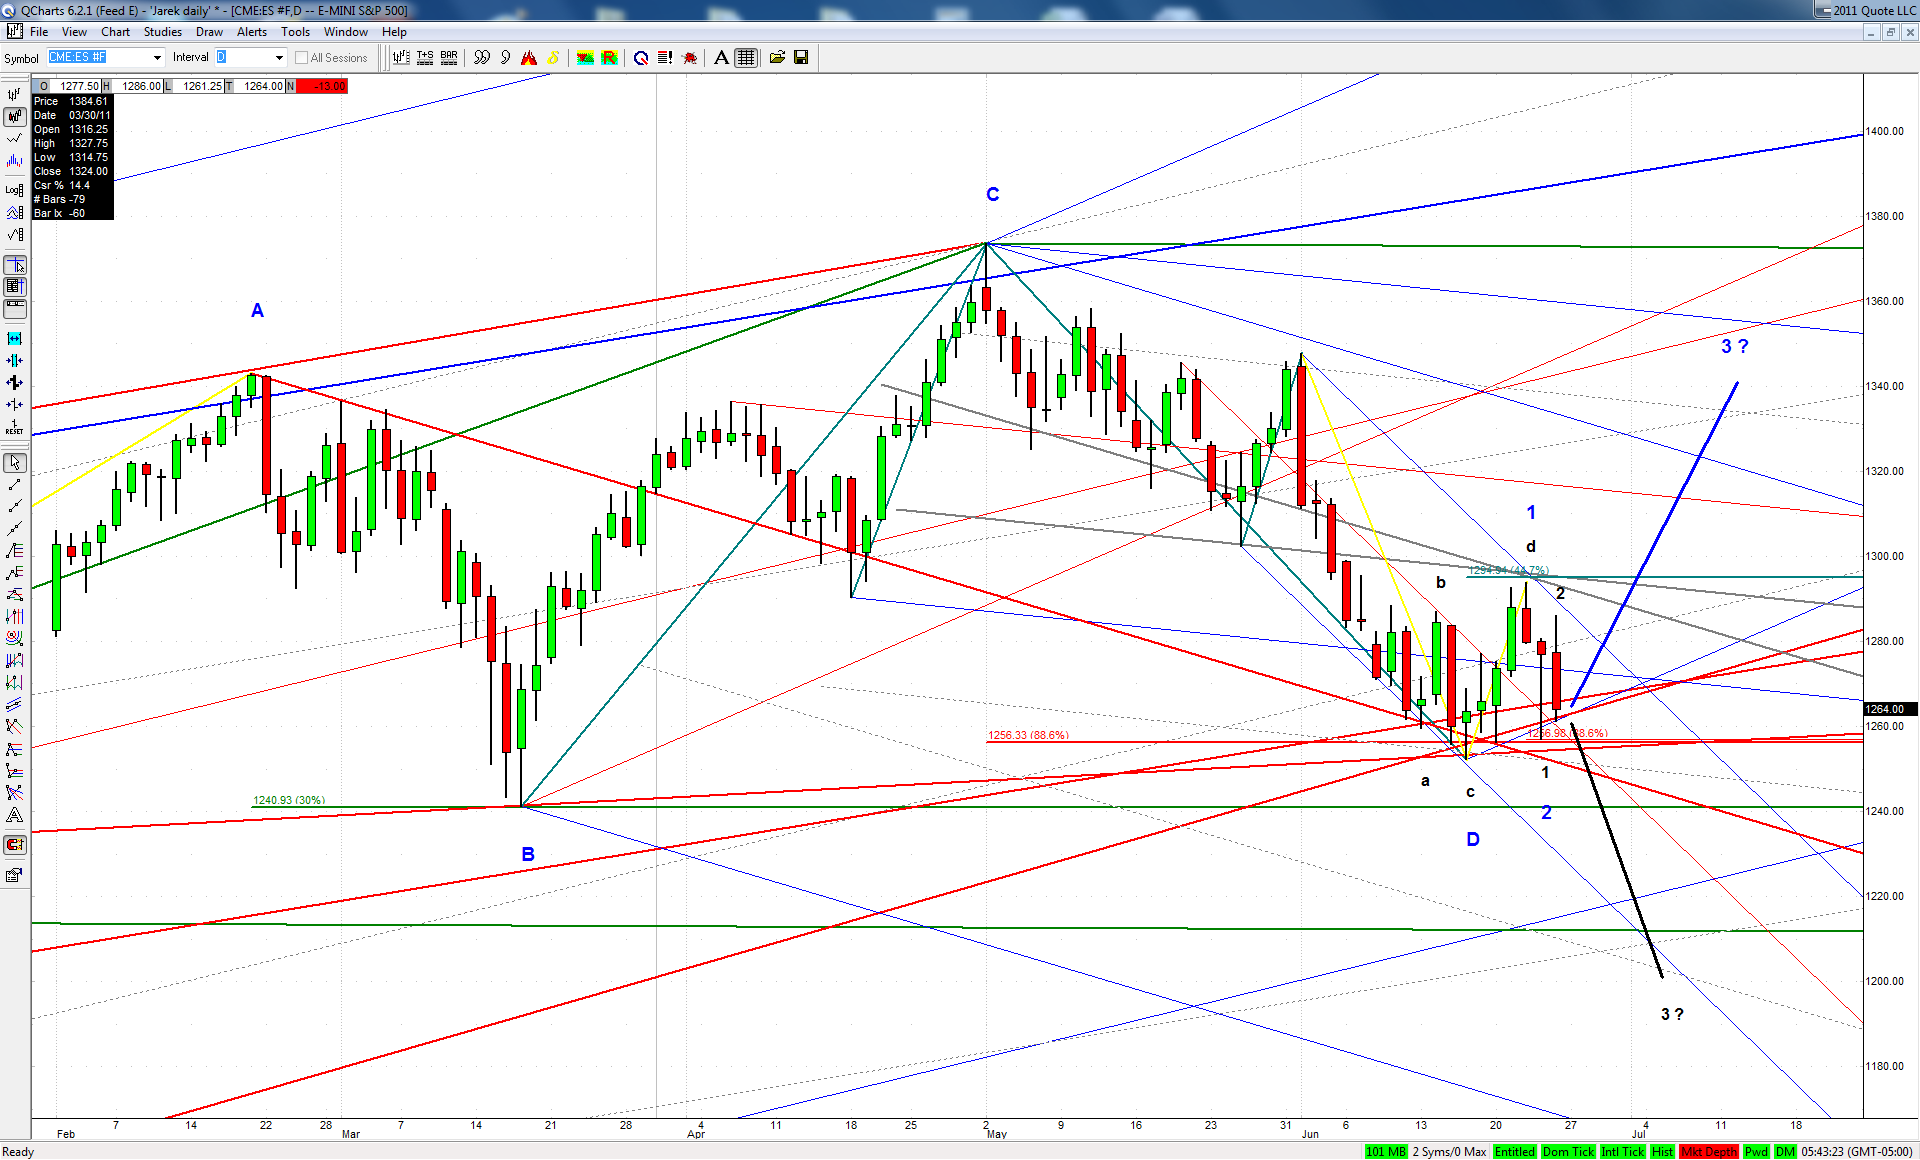
It is now one way or the other IMO:

Click image for original size
AL
albert
Rep: 99
Posts: 3,094
(From an earlier post)

Oops.
In the following, the 25% division line is incorrect and should read as the 75% division line.

"I look at “spike lines” or “simple lines” based on the Kane ABCD points and see them as possible S/R. to price progress. Price was looking strong when it completed the DBS, reacted to it (on the 1 min), and headed back up from near the DBS-based 25% division line/21 SMA confluence. For my own trading only, I am thinking DBSs are vulnerable to failure near the 25% division line. I have seen it a few times. Price dropped from the dbs endpoint to the 25% division line / 21 SMA confluence, acted strongly, so I stayed in the trade. I hope this is not too confusing. My goal is to stick longer with successful Kane ABCD trades, thru better trade management.

BTW, the dbs on the 1 minute chart is not the same as the dbs on the 233 tick chart, they are different. I thought that was worth a comparison. Probably too confusing, though. One last thing, 1 minute chart price drop to the DBS-based 25% division line/21 SMA confluence shows up on the 233 tick chart as a “zoom and retest” of the upper ML //."

Good Trading,

Al Kamego
JI
jimkane
Rep: 3,058
Posts: 33,089
If this super-key defended area here (on the 3-min) gives way, my next level below is 87 quart to half. If it gets there and doesn't jump up, I'll perhaps post my next lower level.
JI
jimkane
Rep: 3,058
Posts: 33,089
89 here is the 1.000 ABCD, TL, .382...
TX
tx_ches
Rep: -10
Posts: 514
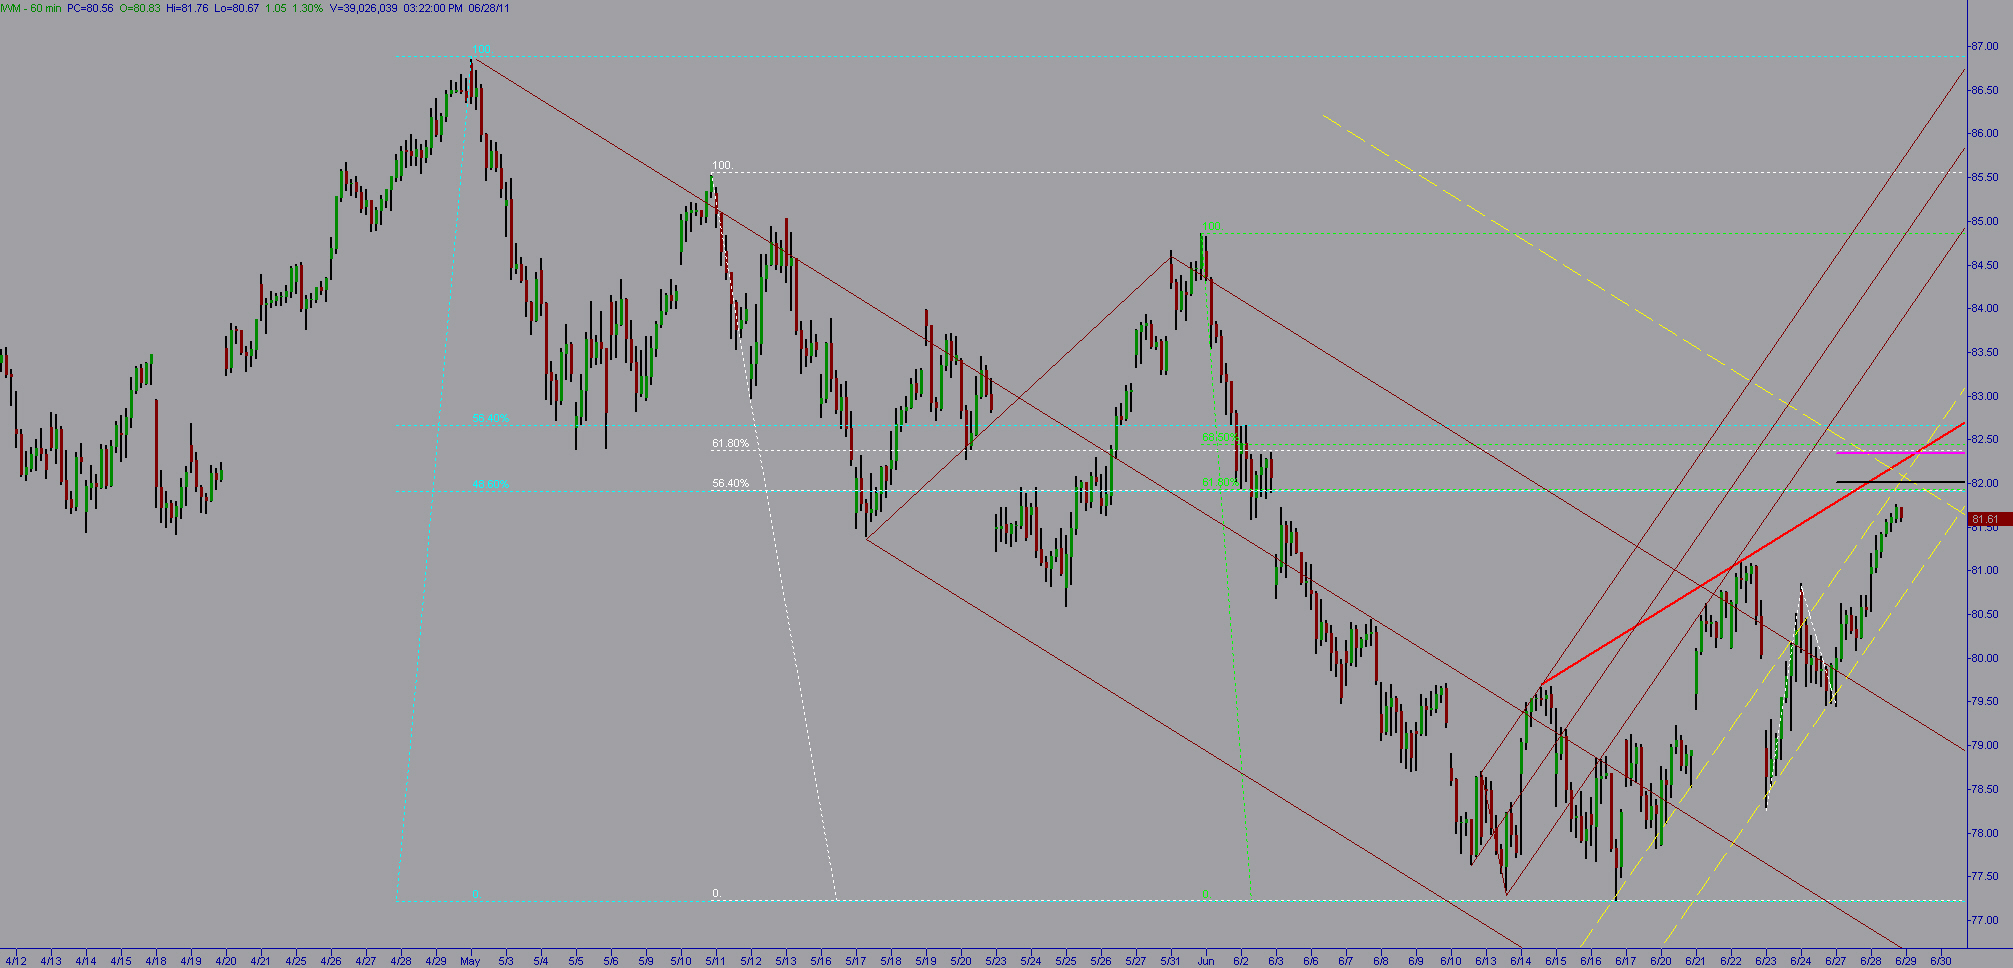
IWM 60 minute.
I'm watching the 82 to 82.50 area for confluence. I wouldn't be surprised if a gap above it happens.
The white dashed outlined leg up and its retrace completes at the black solid line. Its 112 completes at the magenta solid line just above it.

The 120 and 240 charts may have lines from MLS at that same area. But nothing on daily or weekly.

Click image for original size
JI
jimkane
Rep: 3,058
Posts: 33,089
That SL into an ABCD is very key, in my opinion.
JI
jimkane
Rep: 3,058
Posts: 33,089
Watching 92.75-93.50 next.
JI
jimkane
Rep: 3,058
Posts: 33,089
I'm not saying it gets there, it may just chop in this upper range until close, or cash close, but those are my levels if it does move either way.
JI
jimkane
Rep: 3,058
Posts: 33,089
93 hit. Well, fancy that.


Originally posted by jimkane

Watching 92.75-93.50 next.
ER
EricD
Rep: 63
Posts: 692
Originally posted by jimkane

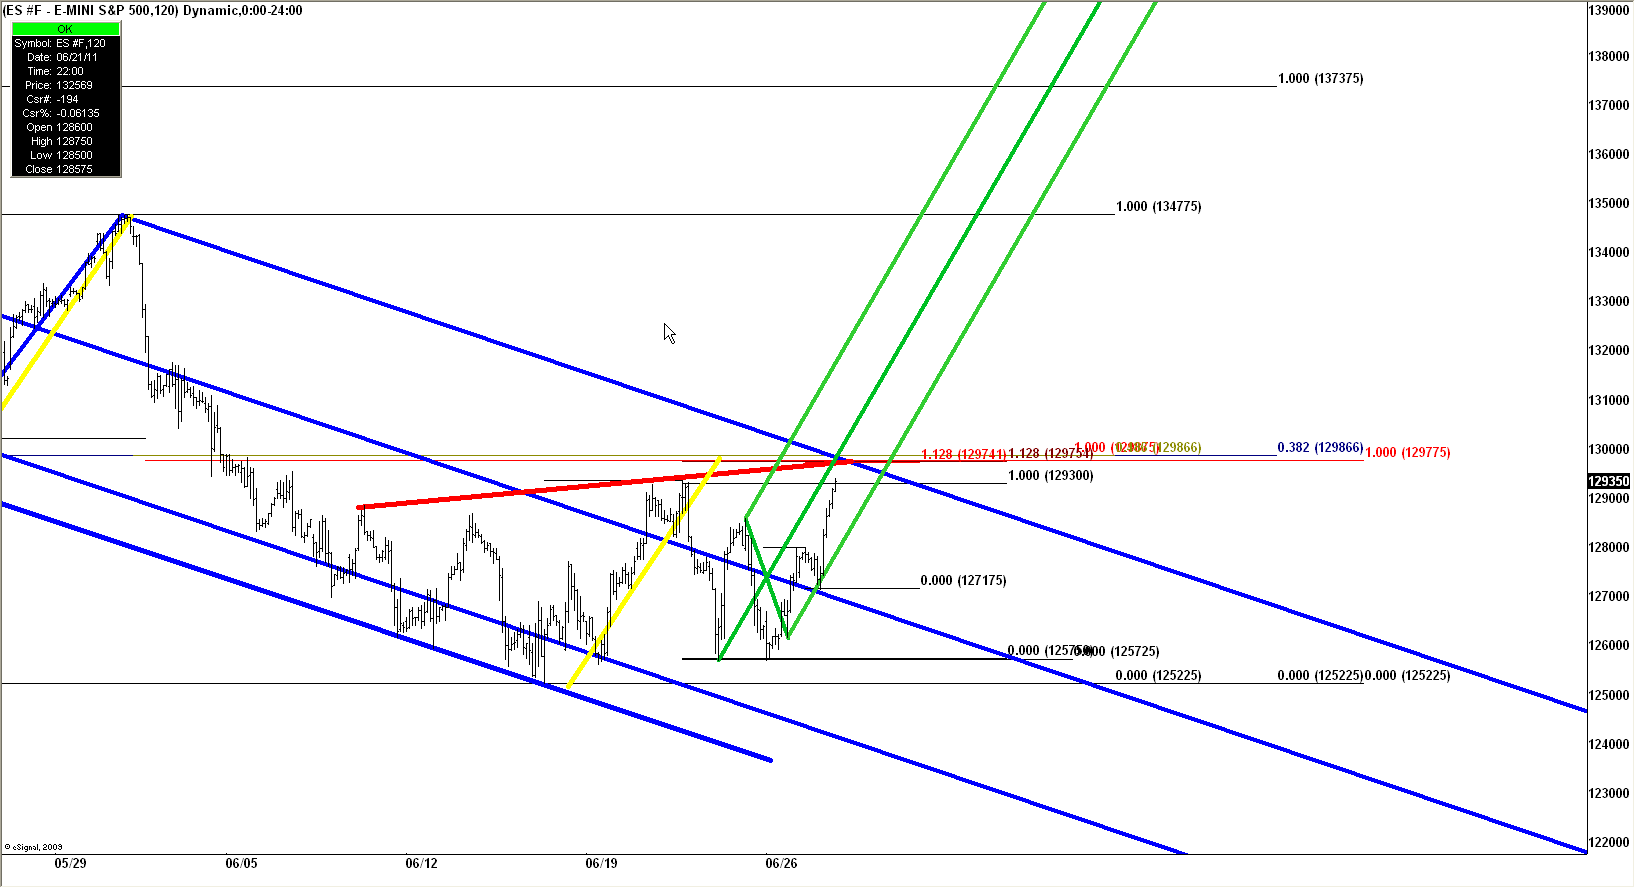
My next area is coming from a much higher timeframe, so the range right now is 1294-1300. The 1.000 ABCD is at 98.50. It could even stretch a bit over 1300. But, somewhere in there is the key zone. It acts like it wants to get there for today's close. Wouldn't that be something, in keeping with my close right at a critical area theory. I'll be staying strongly long-side bias until that area, or until it starts actually moving down. Understand, if the 1300 area gives way, it will be acting like a 'W3', and that would speak for potentially much higher prices. Recall that 1325-35 area I mentioned way back. I give that area very high odds if they can't turn this down soon.
Click image for original size
JI
jimkane
Rep: 3,058
Posts: 33,089
94! That's the 1.618 ext ret of that last pullback, and the confluence of all my uptrending lines. Anything above that and it's blowing out immediate resistance. Recall it is now also into the lower part of my much higher timeframe area. Like I thought, it wanted to close/get near a super-key area. Just unreal strength. Big-time terrified to even think short strength into a key area. How many times have we seen this before?
RO
roofer
Rep: 3,689
Posts: 3,574
Click image for original size