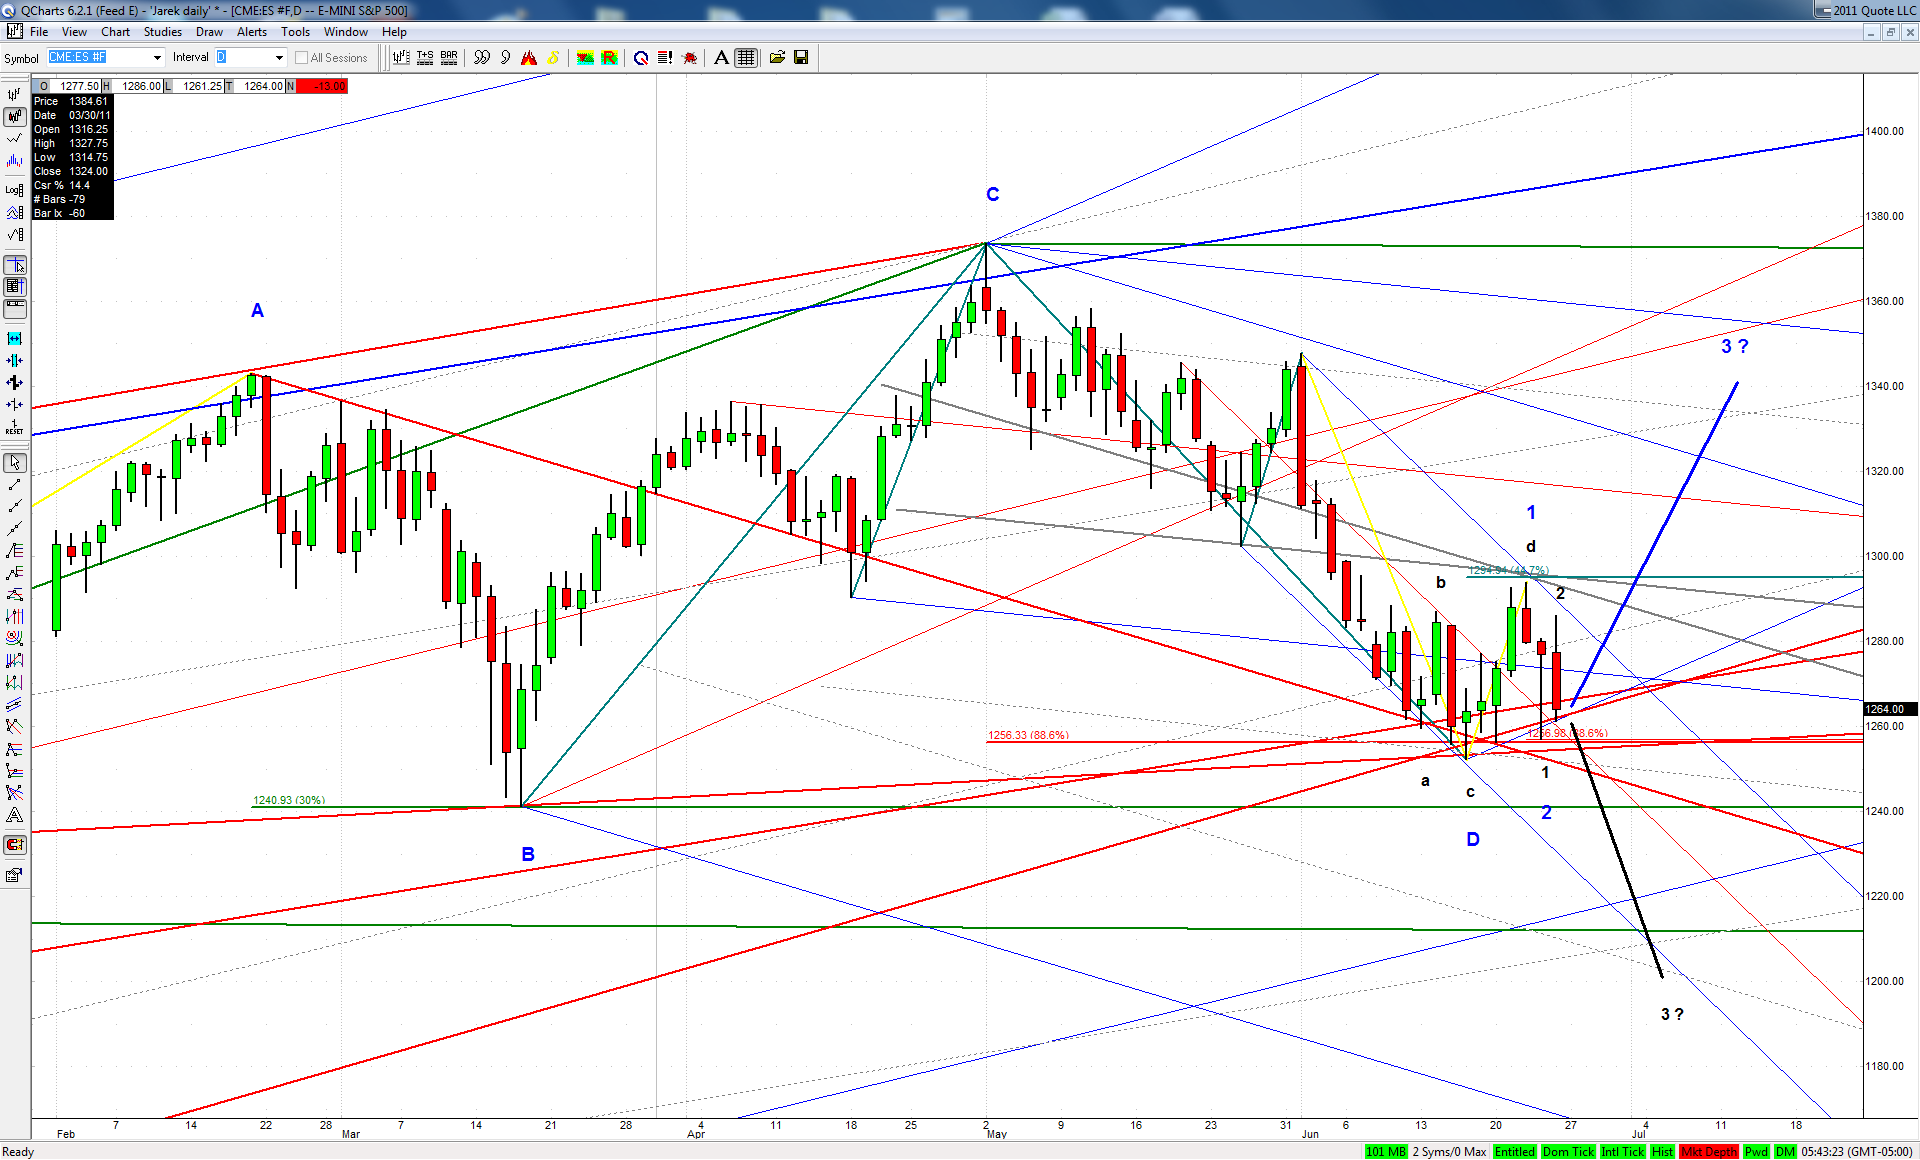
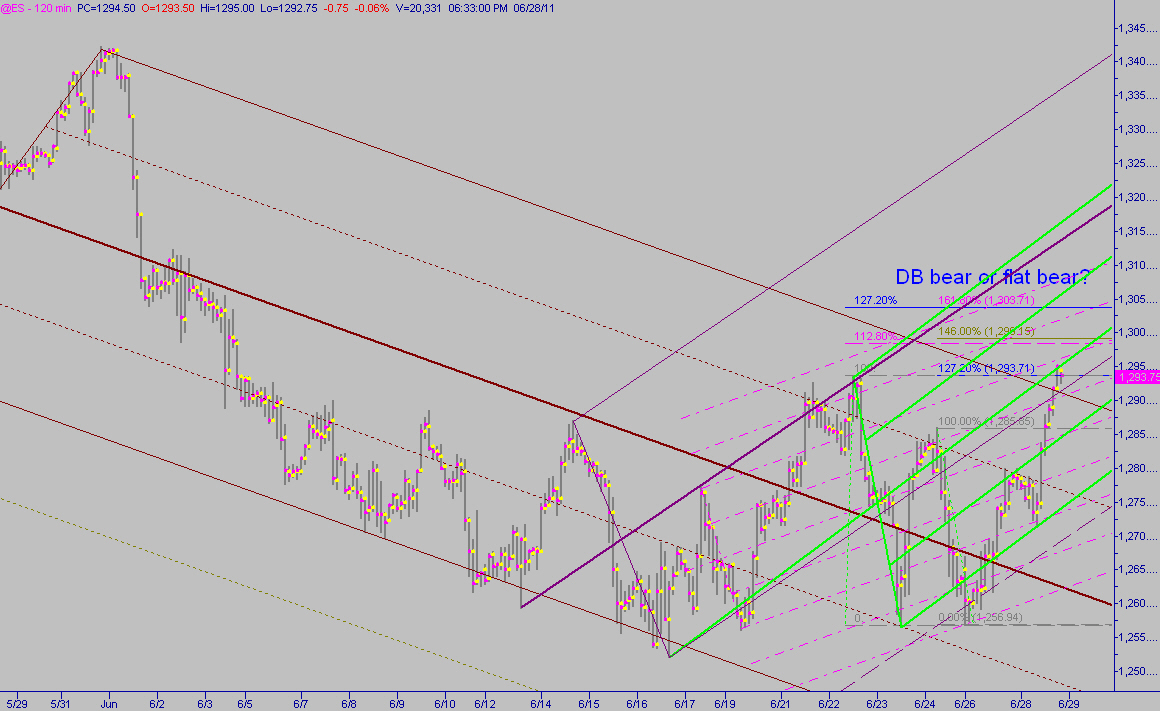
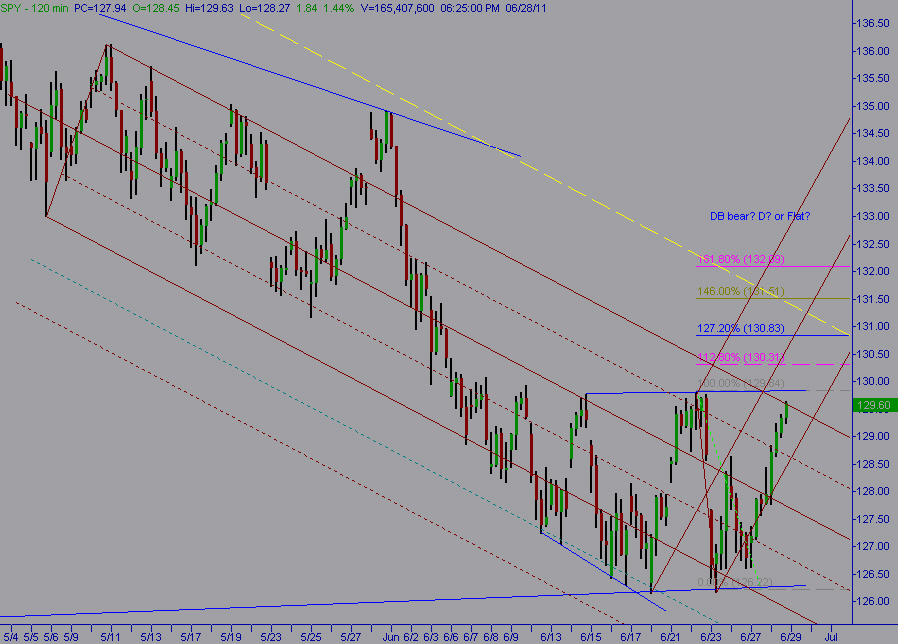
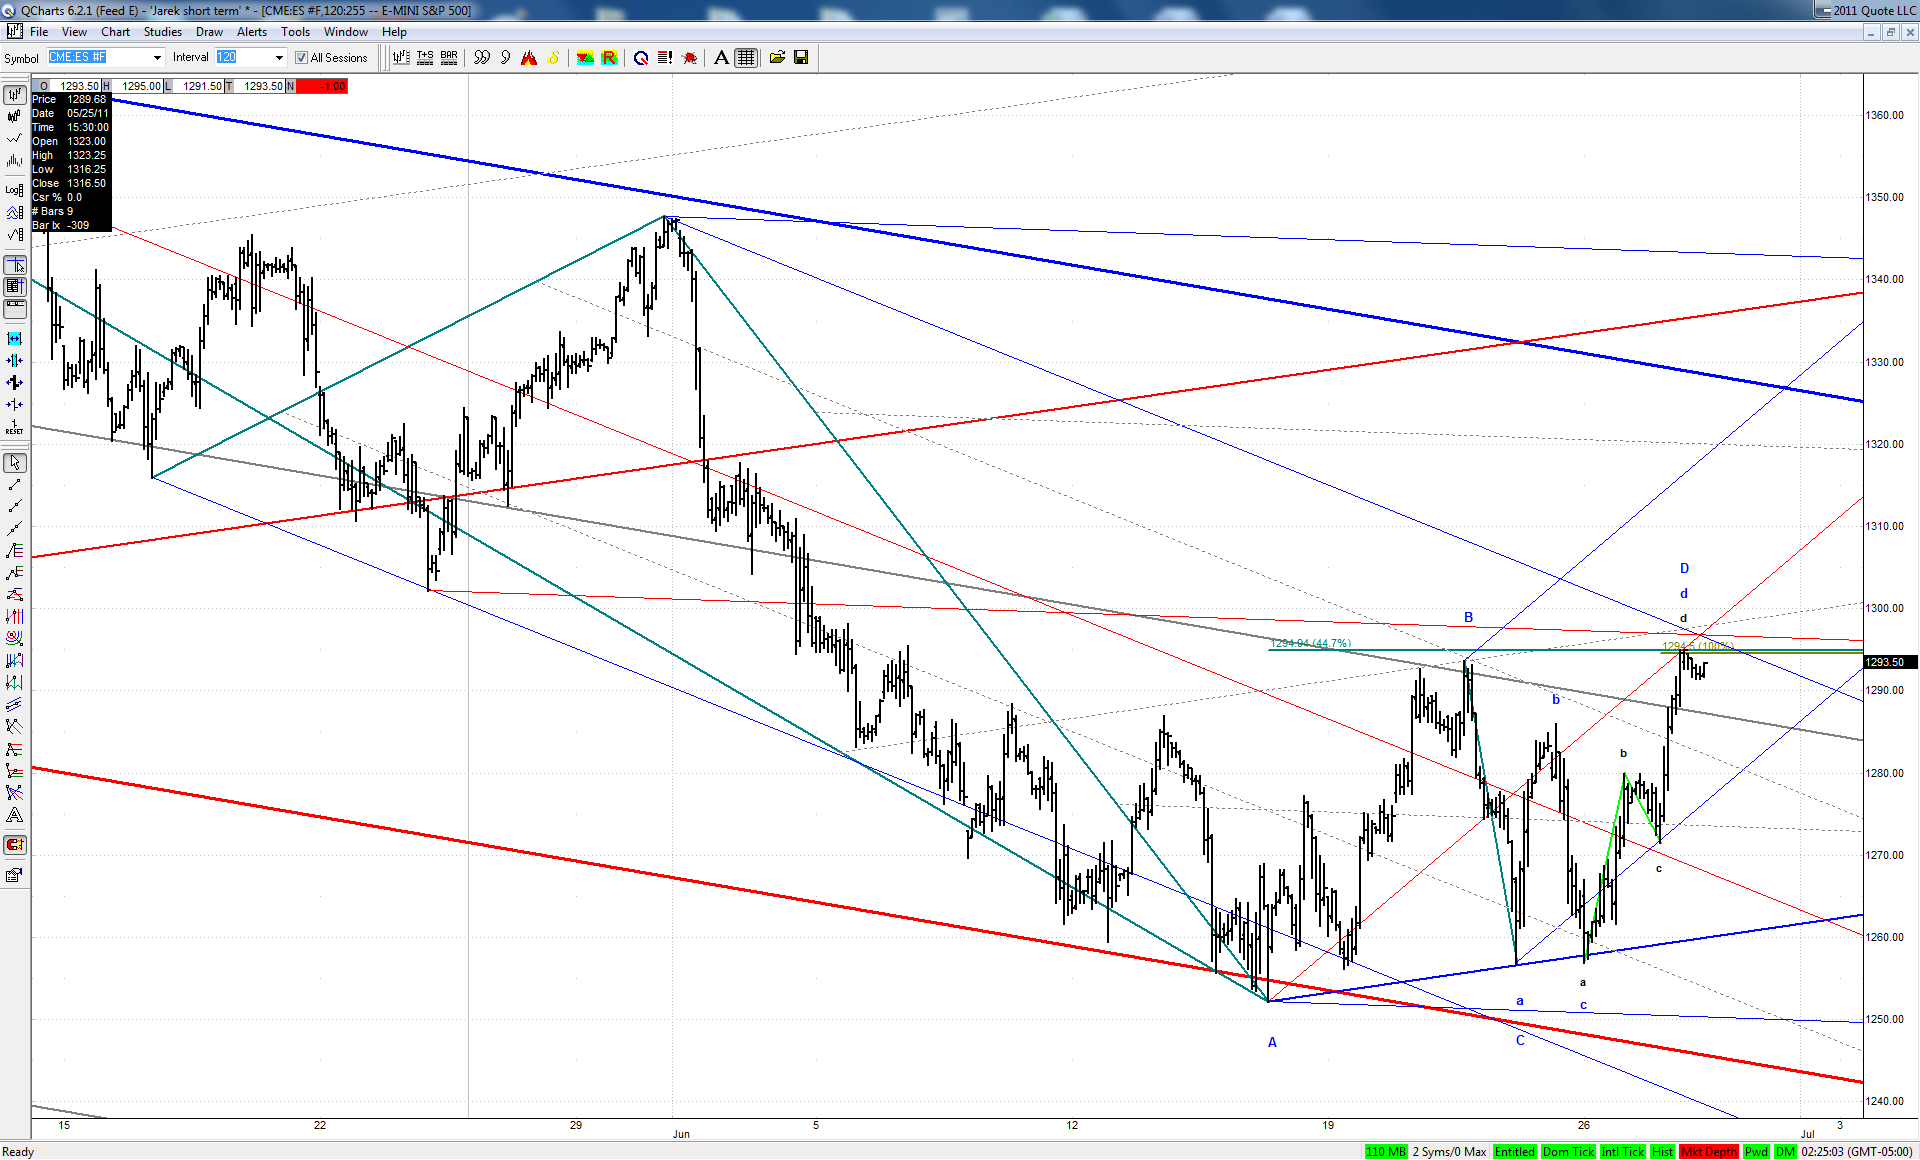
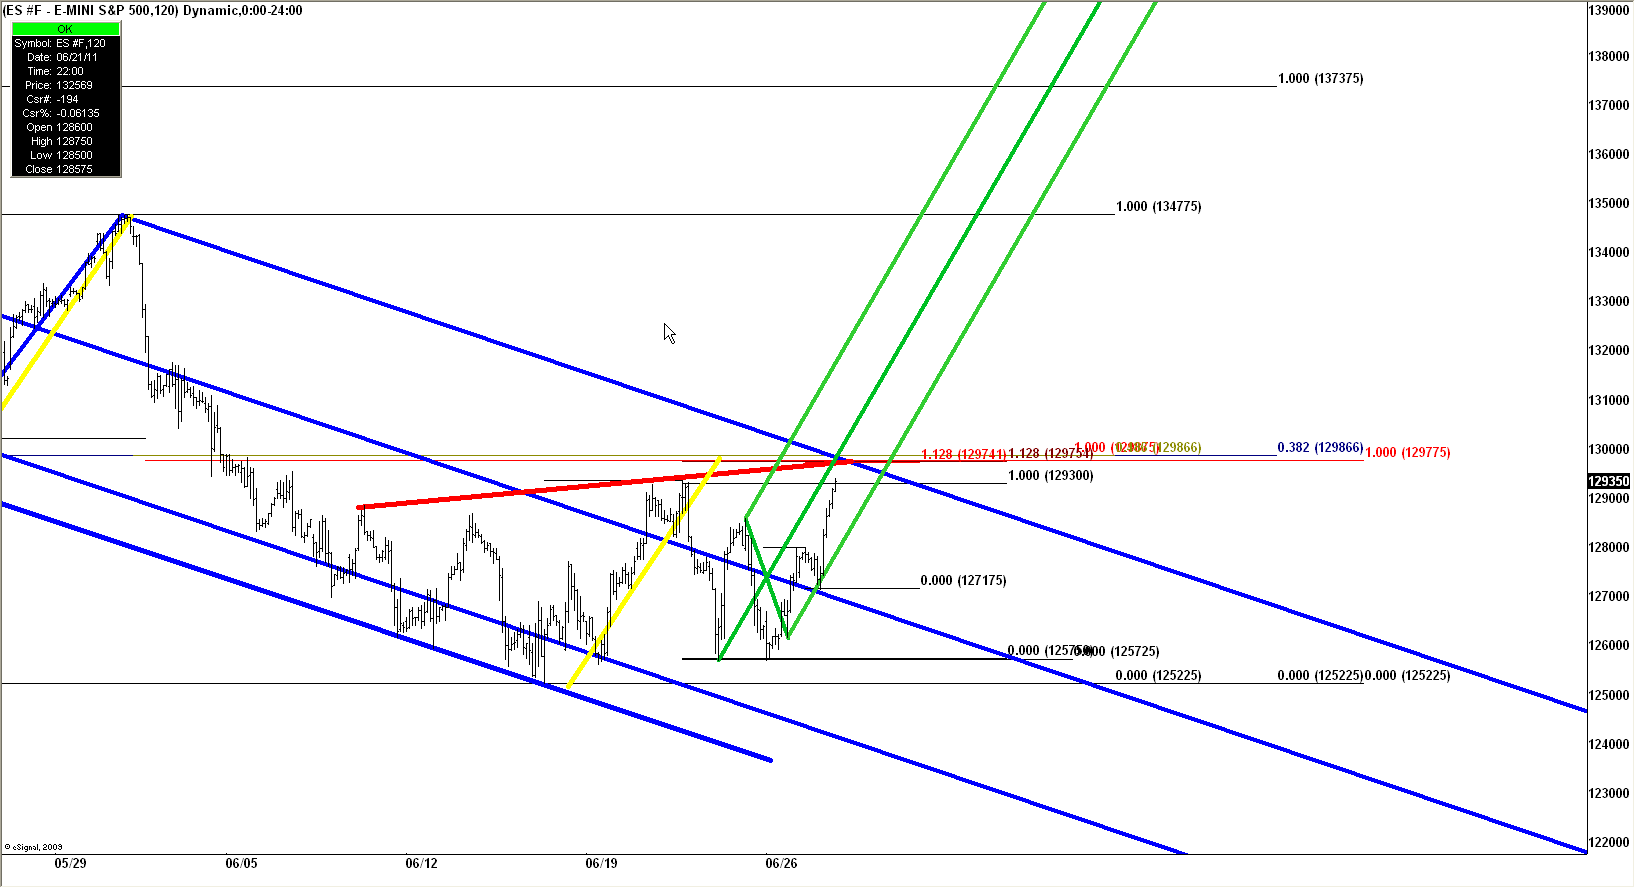
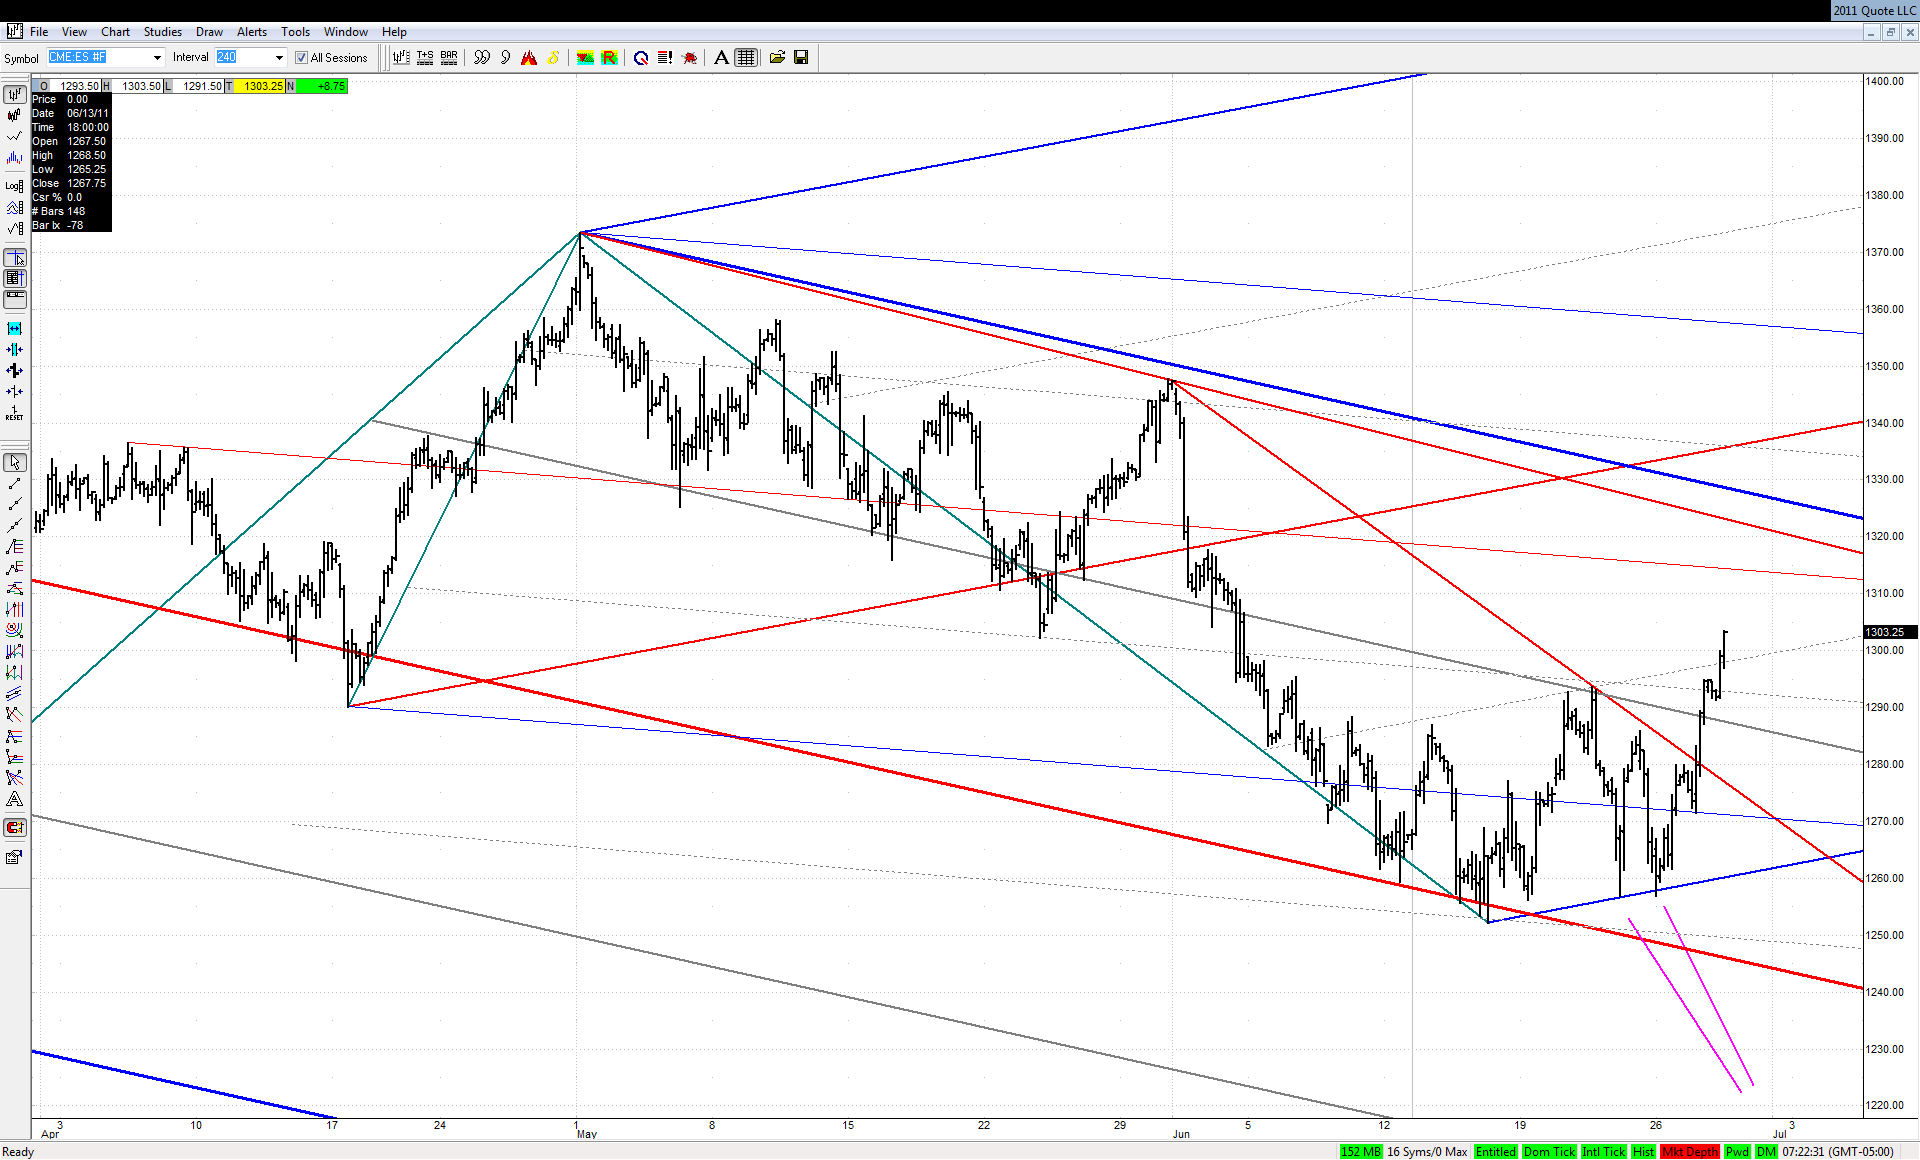
It is now one way or the other IMO:
JI
jimkane
Rep: 3,058
Posts: 33,089
That's the spot.
Originally posted by EricD
Originally posted by jimkane
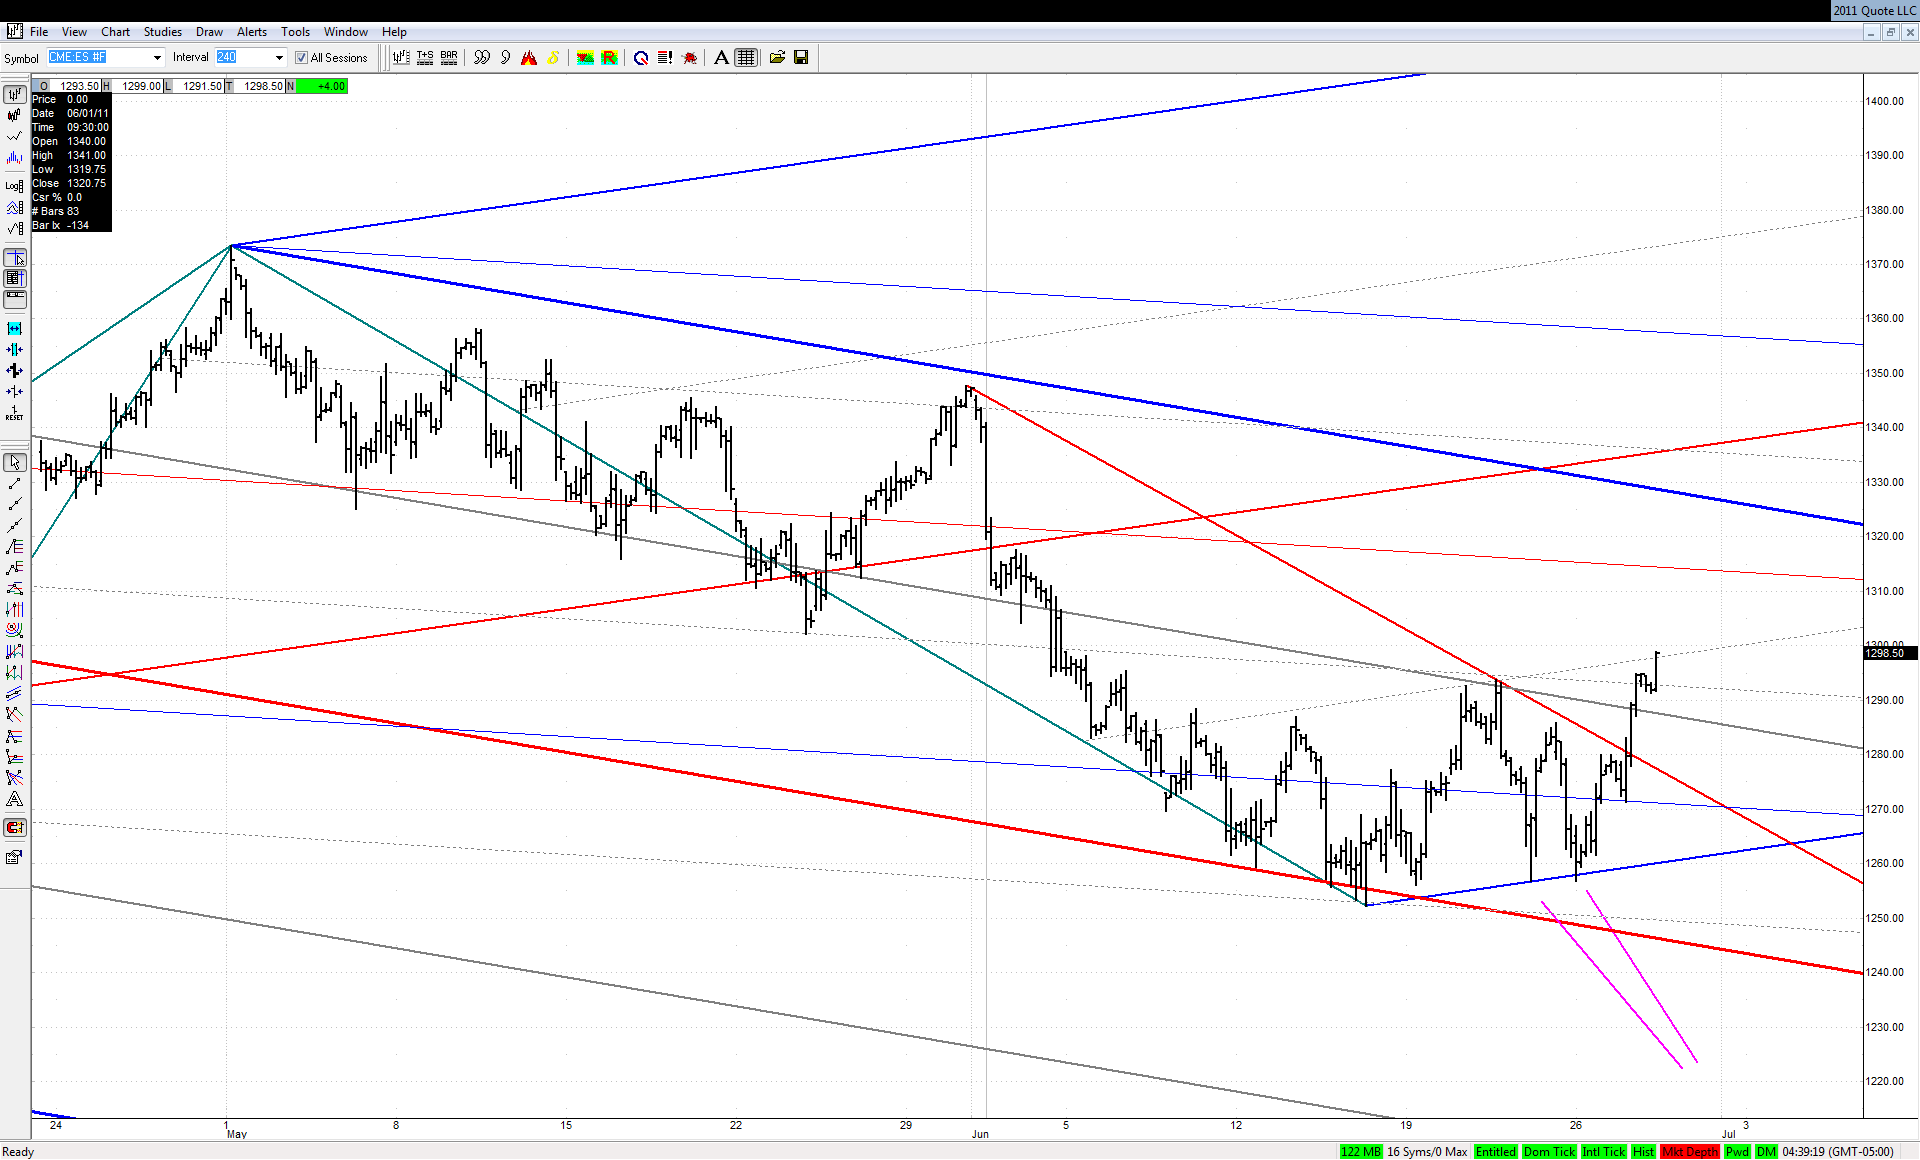
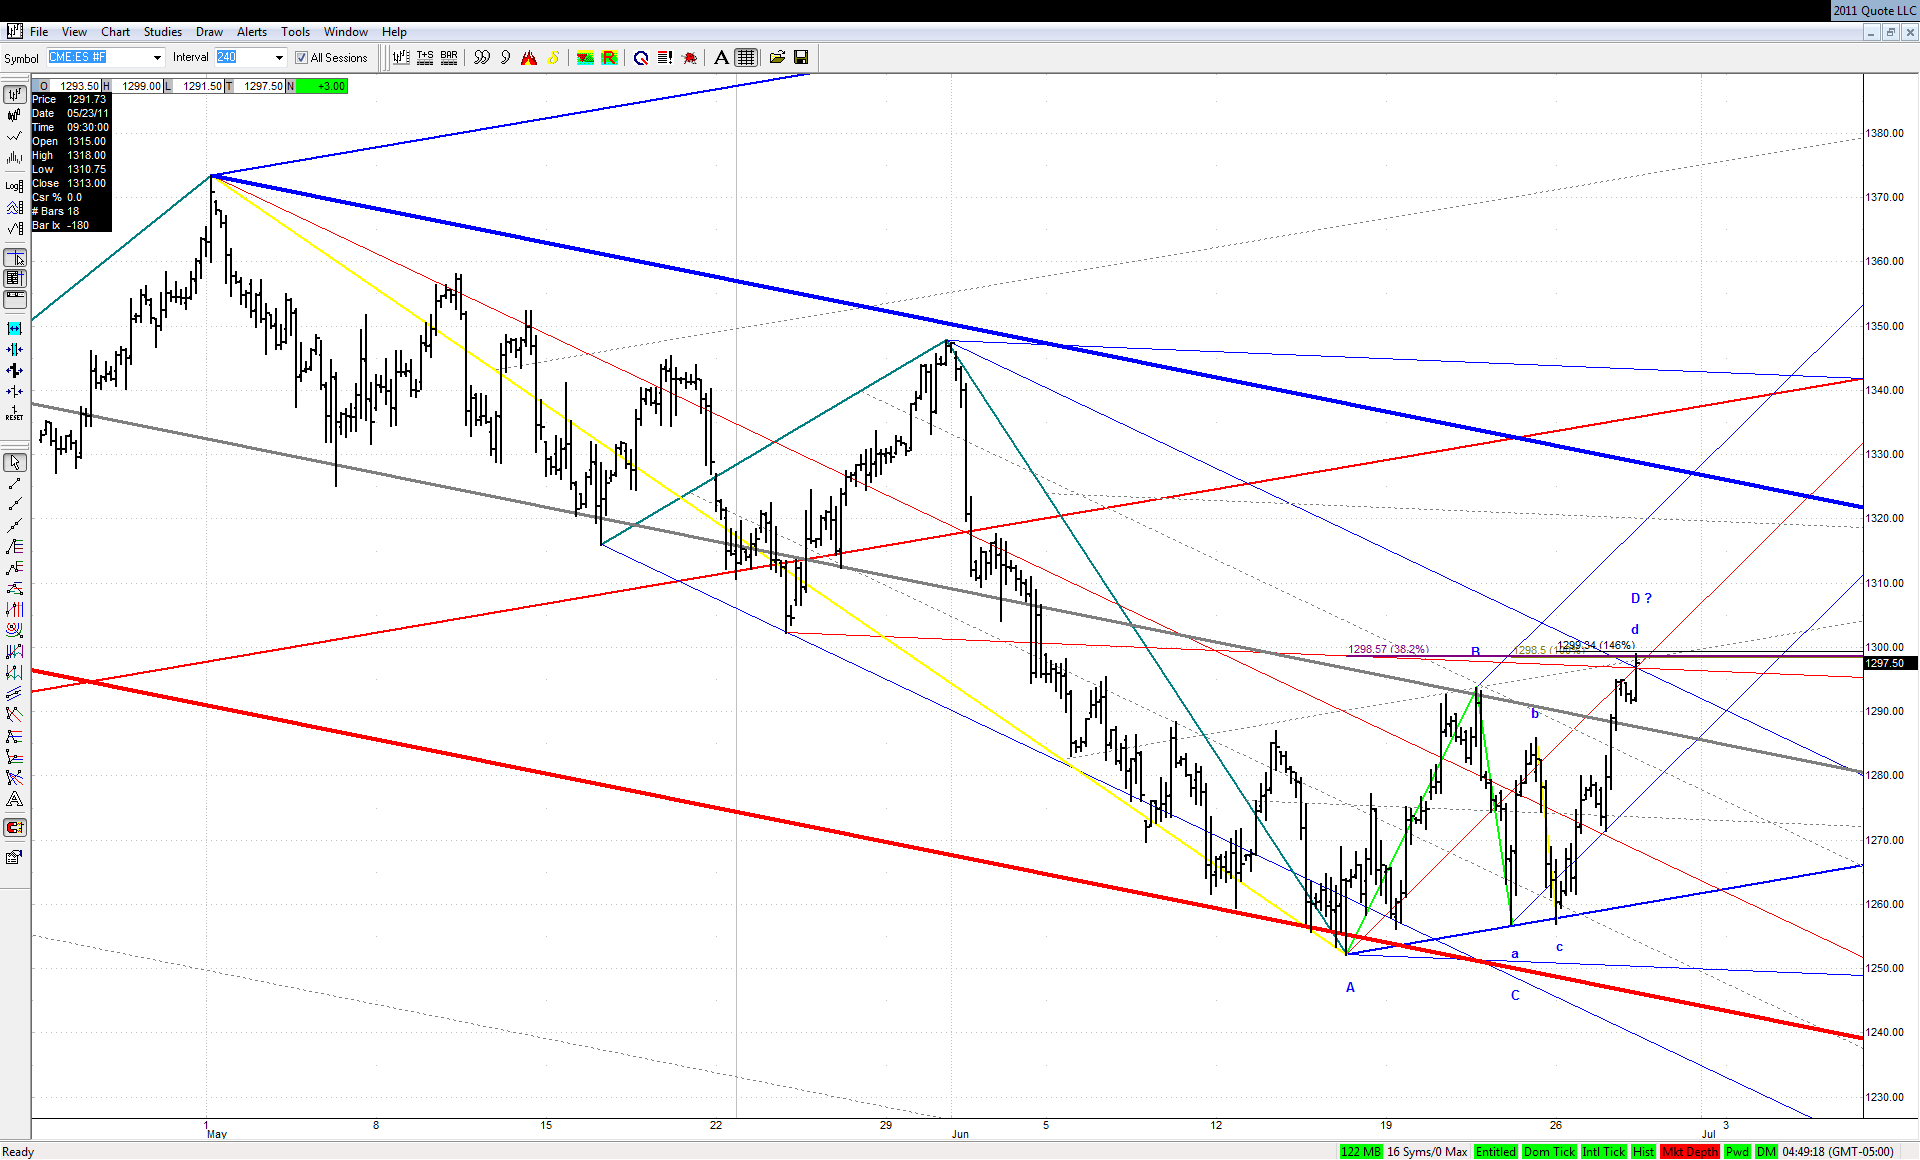
My next area is coming from a much higher timeframe, so the range right now is 1294-1300. The 1.000 ABCD is at 98.50. It could even stretch a bit over 1300. But, somewhere in there is the key zone. It acts like it wants to get there for today's close. Wouldn't that be something, in keeping with my close right at a critical area theory. I'll be staying strongly long-side bias until that area, or until it starts actually moving down. Understand, if the 1300 area gives way, it will be acting like a 'W3', and that would speak for potentially much higher prices. Recall that 1325-35 area I mentioned way back. I give that area very high odds if they can't turn this down soon.
JI
jimkane
Rep: 3,058
Posts: 33,089
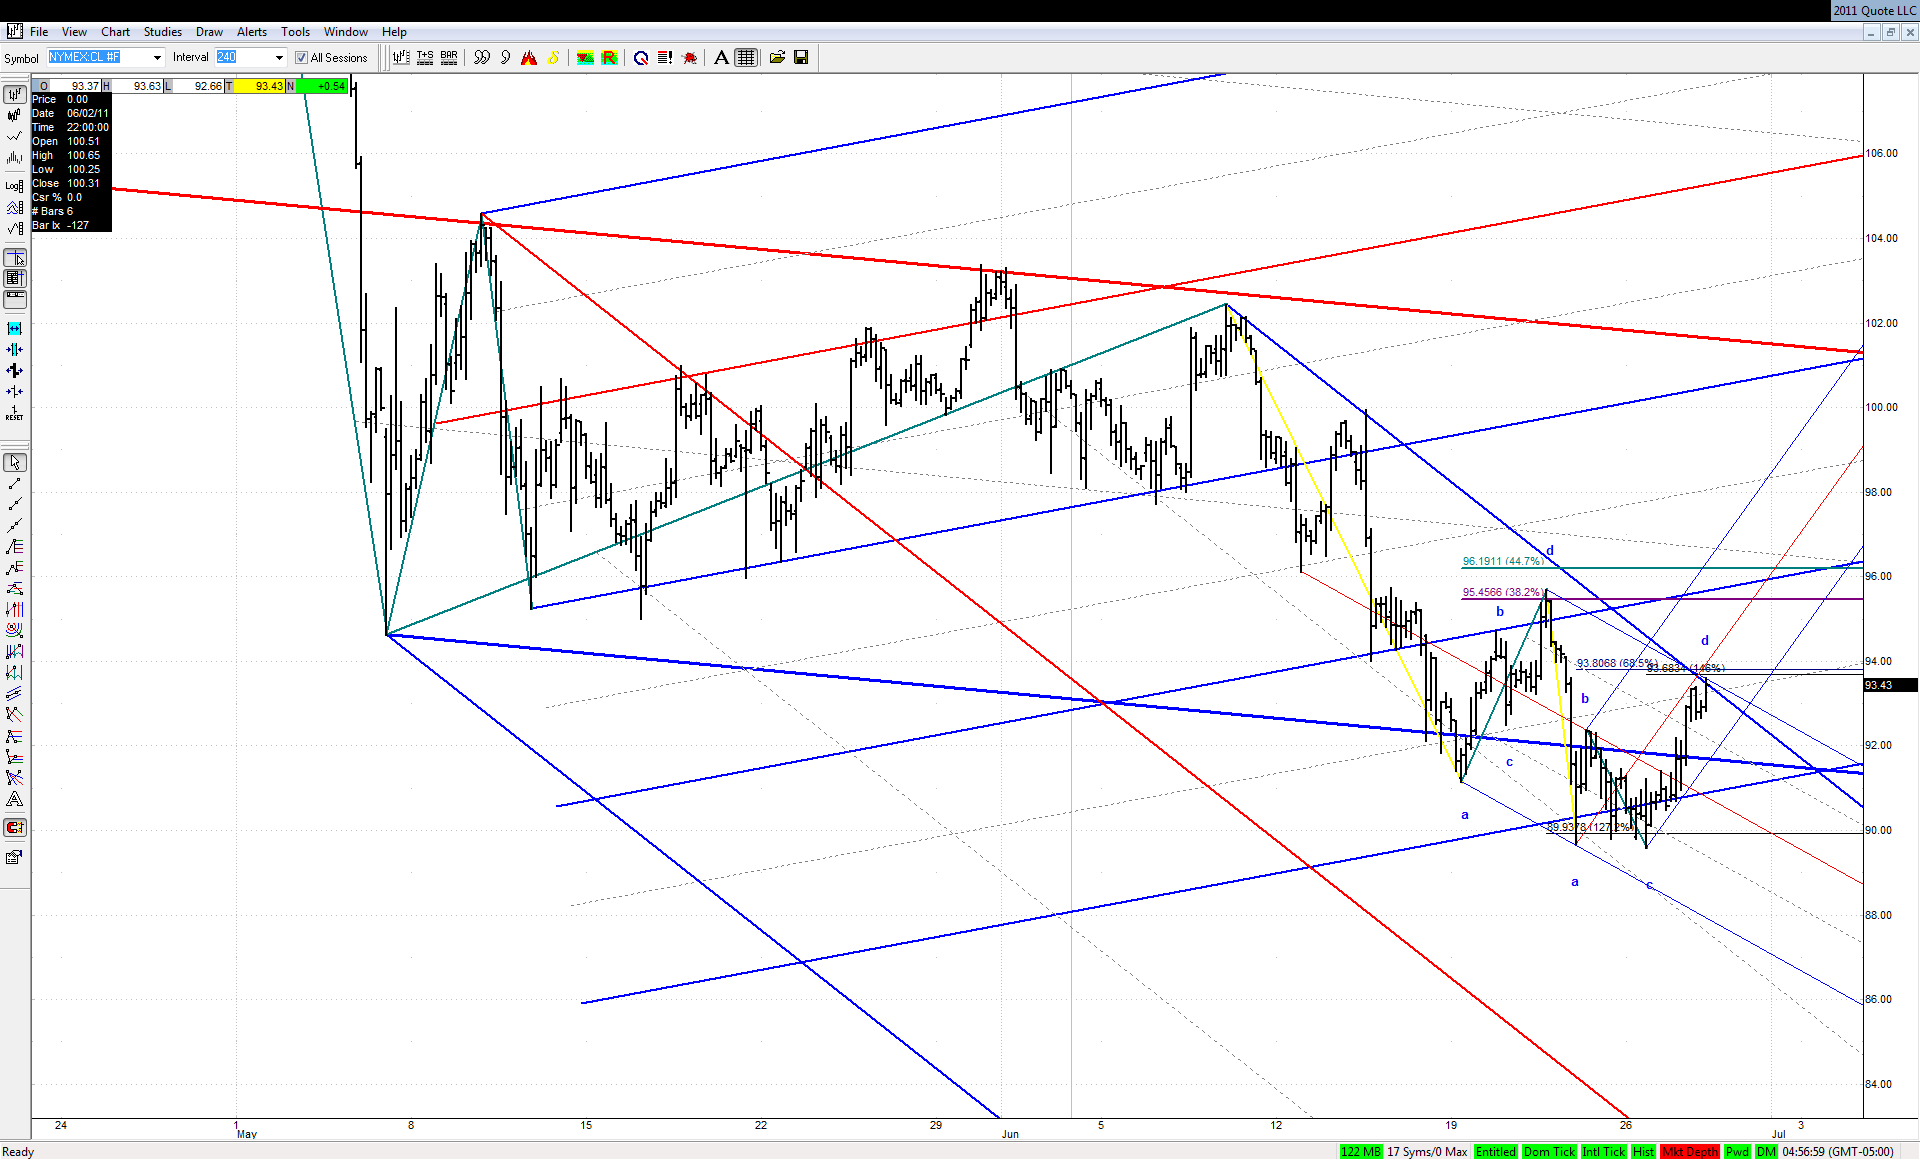
They don't care one tiny little bit about short-term resistance here. All they care about is that bigger, higher timeframe area. ES closes after hitting 95! GLOBEX will likely open and run up, getting deep into the key area. Then we see if it's a 'W3', or that's it. If it blows out this incredible area then I think it will want 1325-35 fast, in keeping with a 'W3' acceleration. I could see it putting that 30-40 points on in the next few days, if this area gives way. But I wouldn't be shocked at all if it drops off here.
I still can't imagine this not shooting for that 1160 area, especially after all those 'tests' of the triumvirate TL/March low/200-dma there. Like that should 'hold' longer-term. Hah. It was a pathetic 'bottom', technically, to me. But in the centrally planned 'United States of Amerika', where are stolen tax dollars and depreciated stolen savings are used to force up the market (did you know that the head FED trader (the FED has traders????), Brian Sack, meets with the primary dealers (JPM et al) every morning before the market opens?), well, then maybe that bottom is very technically sound...
MA
MarcinO
Rep: 67
Posts: 5,506
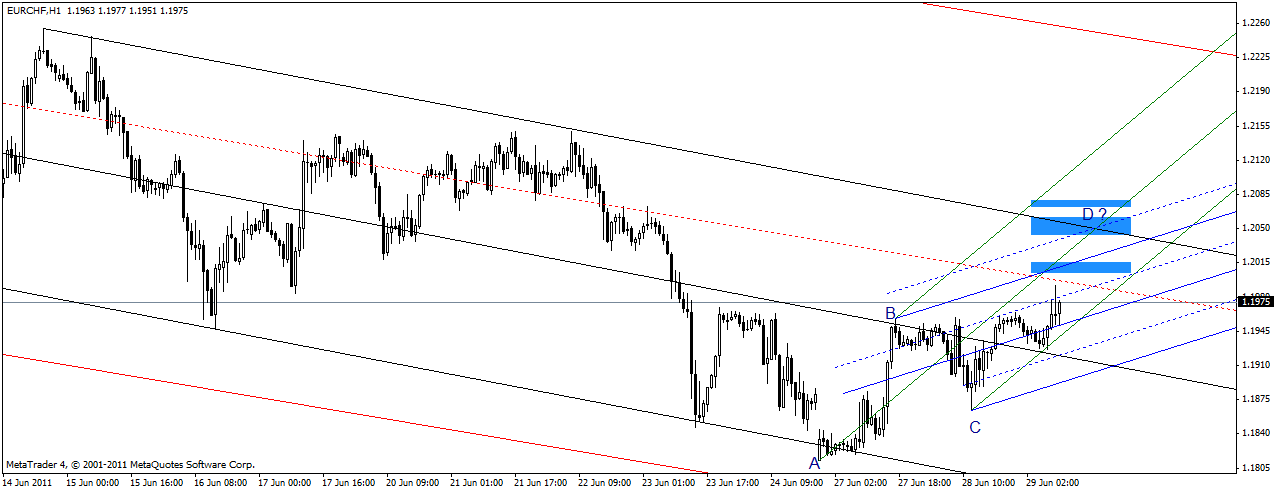
EUR/CHF is shaping nice ABCD.
Blue rectangles are price groupings of retracements of previous highs along with AB APP (1.00, 1.272 and 1.46) and BC EXT RET.
The middle grouping doesn't fall into KZ of any previous major highs but its offset by ML's confluence. The blue set is modified Schiff (I can't draw perimeter line in my software).
As far as the time is concerned: AB=BC, and potential D point meets exactly the condition CD=1.618BC.
The result will depend on Greek vote but it's still worth observing.