ES Trading for 7-6-11
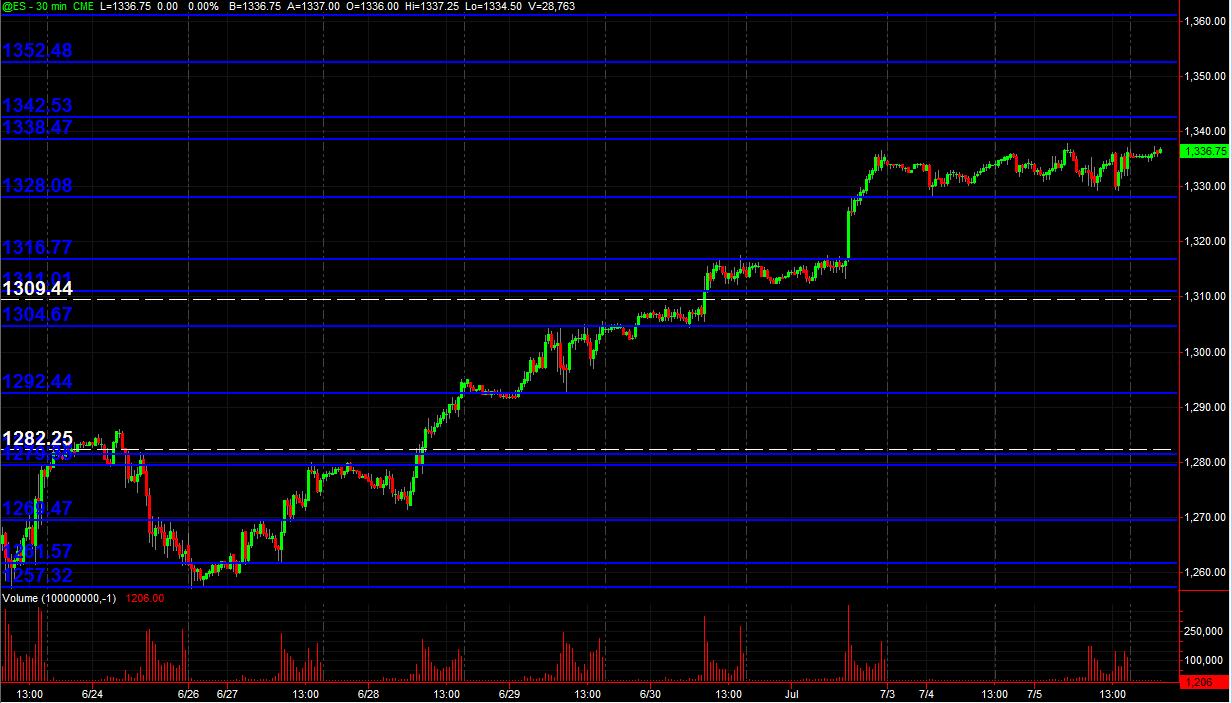
Just posting a 30min chart (all trading hours) with Blue lines as potential significant PASR zones and White dashed lines are Weekly Pivots. It's a map for coming into Wednesday's trading and beyond. After last week's 5 up-trending days, price has been consolidating near the high of that run in the 1328-1338 range of 10 points. Here's the "picture"
Hope some folks find this useful!
Click image for original size
Hope some folks find this useful!
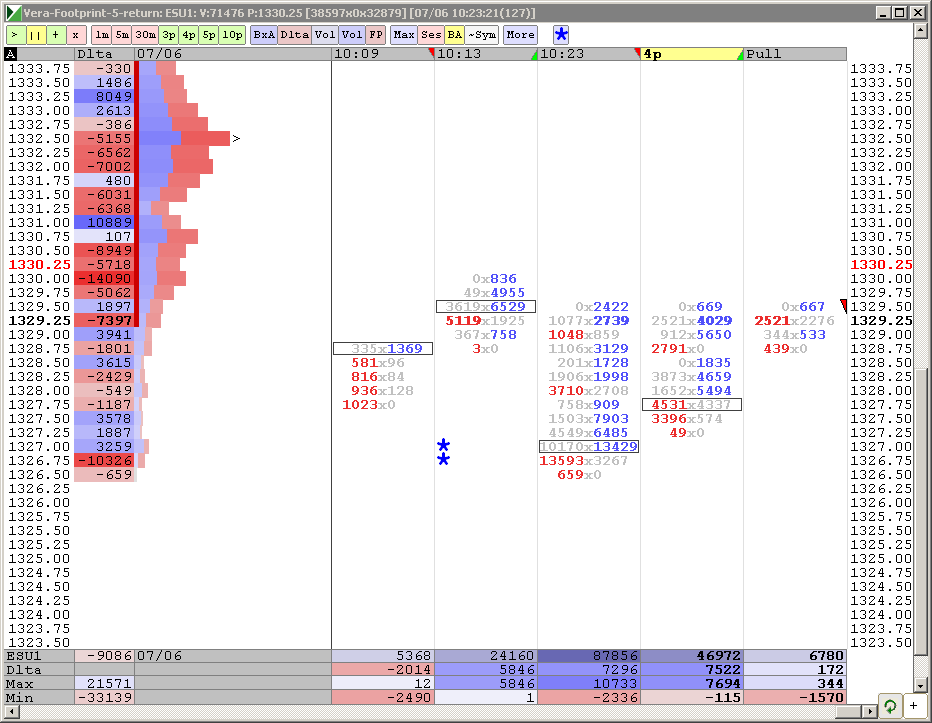
First real volume today. Looks like 1328 held.
Click image for original size
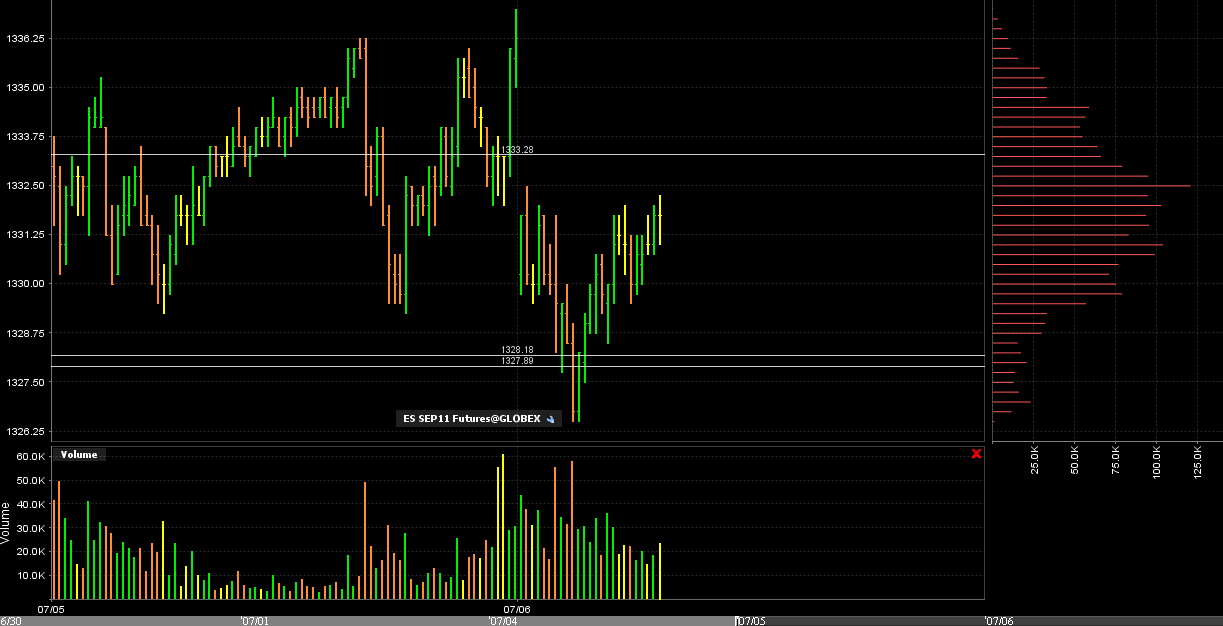
this small rebound is now butting its head against yesterday's RTH L of 1329.25.
if it proves to be resistance, would be exactly the opposite of the bullish action last week when price would move above the H of the previous day, come back and test and then move higher.
if it proves to be resistance, would be exactly the opposite of the bullish action last week when price would move above the H of the previous day, come back and test and then move higher.
30-min traders did not make money on the last breakdown. They should cover
I have 1328 as over/under level
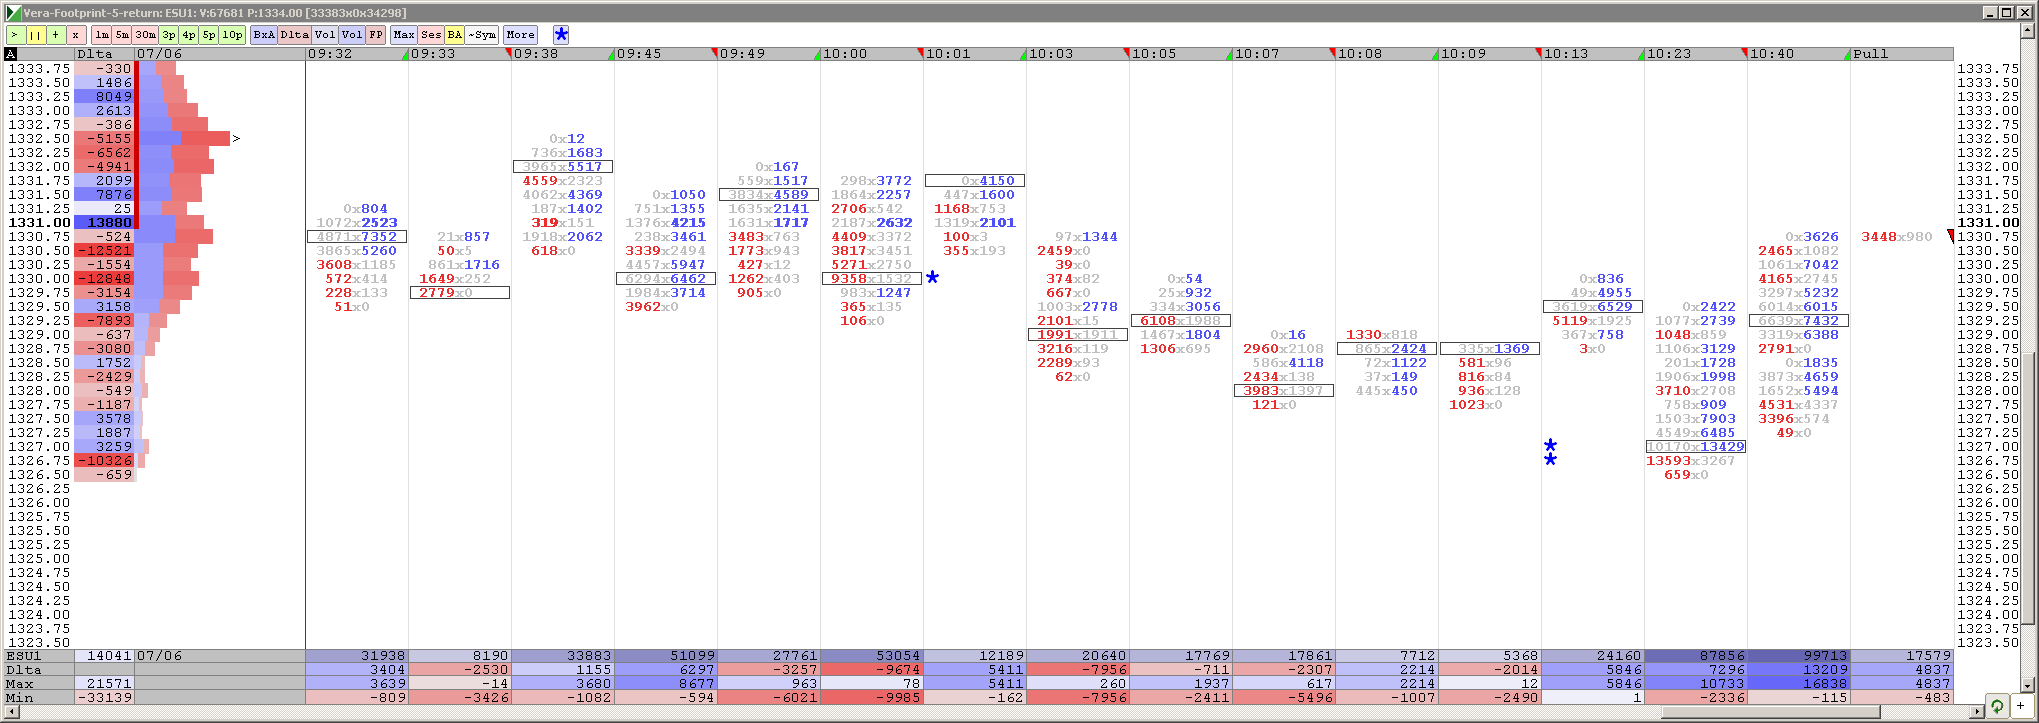
stuck inside the hour range and a gap in the data at 29.75....and all of that is trying to accept price inside the 28.50 - 30 low volume zone we have had from fridays trade...
expecting two sided trade to go fill that gap in data
expecting two sided trade to go fill that gap in data
$ticks interesting at plus and minus 1100...even steven...not setting up for any real trends..standing aside but won't be surprised at another test down into the 28.50 - 30 zone...breakout traders are trying to fiqure out where the plus or minus 4 will hit ...and which one....LOL!!
Lisa, I may have asked this before...but how do u qualify what is first " real" volume as volume is relative based on the day and reports, time of year etc ?
are u using a contstant threshold....? I must say that footprints confuse me as some days we can see big buyers and they get run over by sellers etc...seems to be no consistent patterns
are u using a contstant threshold....? I must say that footprints confuse me as some days we can see big buyers and they get run over by sellers etc...seems to be no consistent patterns
Feng if u r out here today...the market had minus 1100 ticks and then pushed out 1100 ticks on the plus side...the market is also TRYING to find support once again at the 28.50 - 30....so if we break the hour highs I would not be selling into those...I'd rather be wrong on that fade and just miss it....we also have an unfilled gap above and we have been bullish for a few days now....
just pointing that out as some reasons I would not take that fade
just pointing that out as some reasons I would not take that fade
one more reason I won'ttake the fade....the two day bell curve...I prefer the edges and don't like initiating in the middle.....some will take the trade though BECAUSE of this formation...that's what makes a market unique...different opinions..
Click image for original size
Originally posted by BruceM
Lisa, I may have asked this before...but how do u qualify what is first " real" volume as volume is relative based on the day and reports, time of year etc ?
are u using a contstant threshold....? I must say that footprints confuse me as some days we can see big buyers and they get run over by sellers etc...seems to be no consistent patterns
BruceM, attached is my Footprint chart from 9:30 to 10:40.
1. What do I call "real"' volume? Take a look at the morning volumes, as compared to the "report" volume (in 10:00 column)and "support" volume (in 10:23 column) - both high volumes are marked with asterisks. Both the "report" and the "support" volumes are significantly higher than other volumes this morning. I pay especial attention to volumes close to 10,000 contracts and above - this is where Messrs BigWig and BiggerWig operate. IF the support volume is in the significant area, I pay even more attention to the price action.
2. Sometimes big buy volume is overcome by selers. Yes, sometimes it happens. SOmetime Mr. BigWig gives up with little fight (small stop) and sometimtes he is taken by Mr. BiggerWig. Same with your levels - sometimes they hold, sometimes they do not. In those areas, we watch the price action and take stops.
Click image for original size
Lisa, that was simply making my risk equal to reward at that point when price was near 32.75....
Emini Day Trading /
Daily Notes /
Forecast /
Economic Events /
Search /
Terms and Conditions /
Disclaimer /
Books /
Online Books /
Site Map /
Contact /
Privacy Policy /
Links /
About /
Day Trading Forum /
Investment Calculators /
Pivot Point Calculator /
Market Profile Generator /
Fibonacci Calculator /
Mailing List /
Advertise Here /
Articles /
Financial Terms /
Brokers /
Software /
Holidays /
Stock Split Calendar /
Mortgage Calculator /
Donate
Copyright © 2004-2023, MyPivots. All rights reserved.
Copyright © 2004-2023, MyPivots. All rights reserved.