ES Trading for 7-6-11
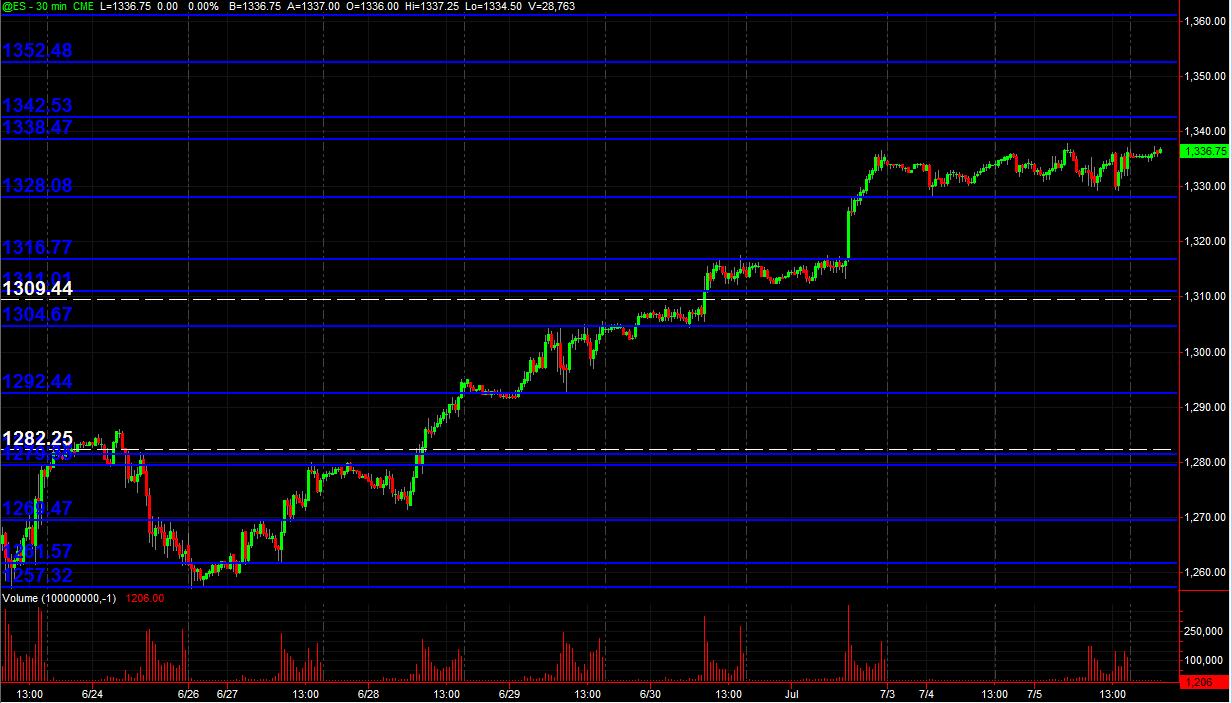
Just posting a 30min chart (all trading hours) with Blue lines as potential significant PASR zones and White dashed lines are Weekly Pivots. It's a map for coming into Wednesday's trading and beyond. After last week's 5 up-trending days, price has been consolidating near the high of that run in the 1328-1338 range of 10 points. Here's the "picture"
Hope some folks find this useful!
Click image for original size
Hope some folks find this useful!
that double top has me pairing some off at 34.75...now......
took one more at 33.50 and holding two for air fill...the double top is a concern and we are back in the center of the two day distribution ( bell curve)
hopefully some can see the logic for that trade...the 30 minute bar that closed at 1 PM e.s.t created the second set of single prints on the day......we have a two day bell curve and a/d were at 1500 to 1300 ..so fairly mixed...not trending like Friday....that double top is the only glitch up here but Nq and Ym didn't make the double top so that is a good thing for shorts
bruce, where are the two set of single prints if you don't mind? i don't have a market profile chart in front of me
I'd like to test myself and give this a shot, if you can correct me.
single print at 1pm as mentioned on the 30 min chart and the other at the open air below 33.
Don't mean to pry... just like to confirm what I think I know. Thanks!
single print at 1pm as mentioned on the 30 min chart and the other at the open air below 33.
Don't mean to pry... just like to confirm what I think I know. Thanks!
Originally posted by NickP
bruce, where are the two set of single prints if you don't mind? i don't have a market profile chart in front of me
i meant what is/was the level of the single print that formed at 1pm ?
That was 1335.50.
Originally posted by NickP
i meant what is/was the level of the single print that formed at 1pm ?
thanks lorn
one more off at 32.75 air fill....Ym and Nq much weaker...YM still has air.....either way this last one won't be easy for me
sorry Nick..multi tasking here over lunch...thanks for getting to that Lorn...
Lisa, that was simply making my risk equal to reward at that point when price was near 32.75....
Emini Day Trading /
Daily Notes /
Forecast /
Economic Events /
Search /
Terms and Conditions /
Disclaimer /
Books /
Online Books /
Site Map /
Contact /
Privacy Policy /
Links /
About /
Day Trading Forum /
Investment Calculators /
Pivot Point Calculator /
Market Profile Generator /
Fibonacci Calculator /
Mailing List /
Advertise Here /
Articles /
Financial Terms /
Brokers /
Software /
Holidays /
Stock Split Calendar /
Mortgage Calculator /
Donate
Copyright © 2004-2023, MyPivots. All rights reserved.
Copyright © 2004-2023, MyPivots. All rights reserved.