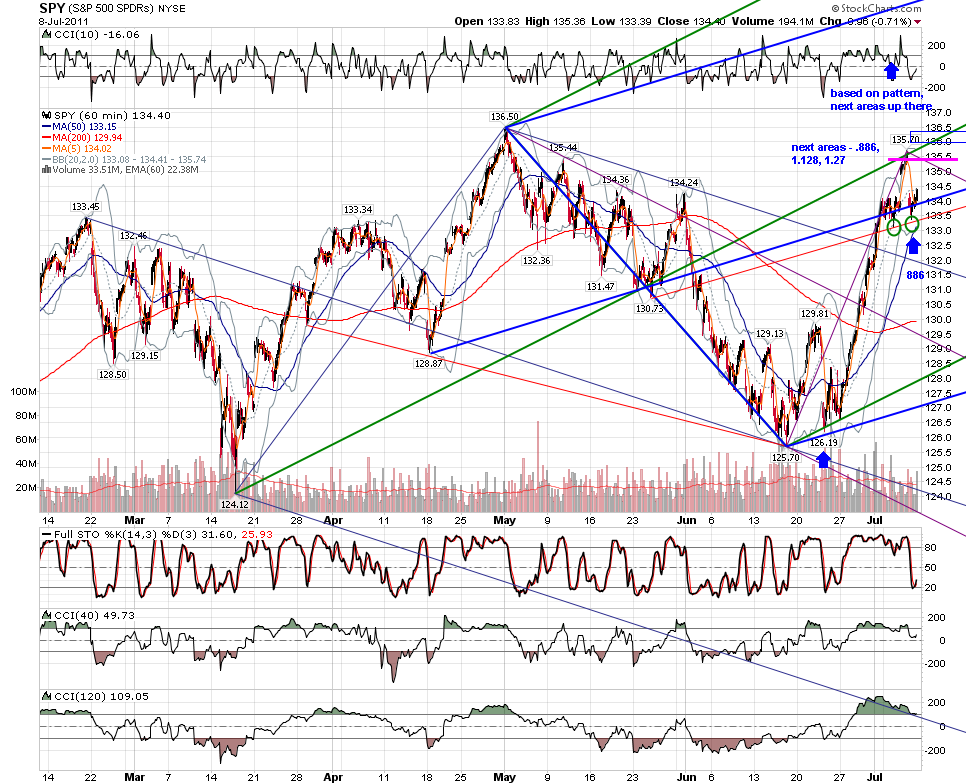
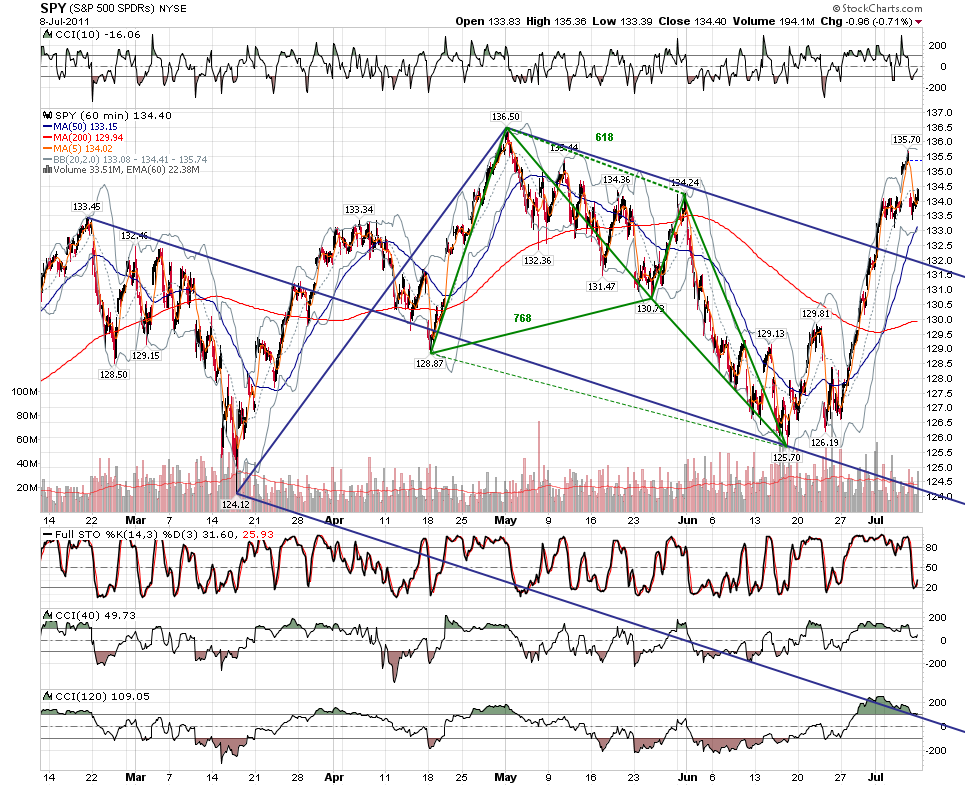
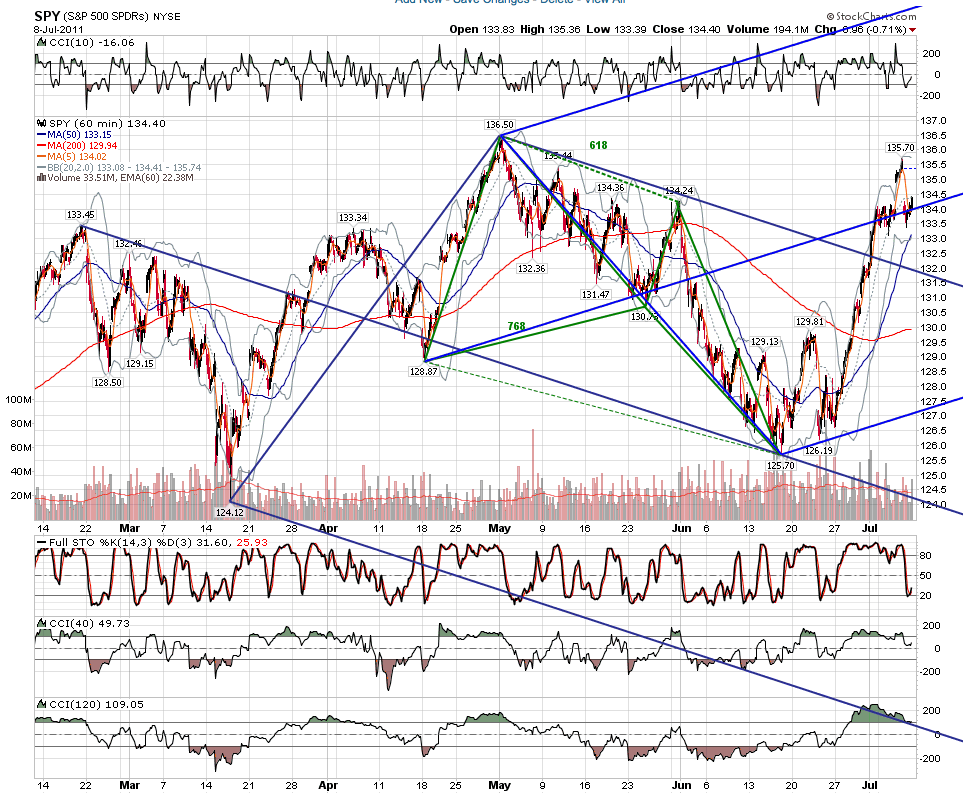
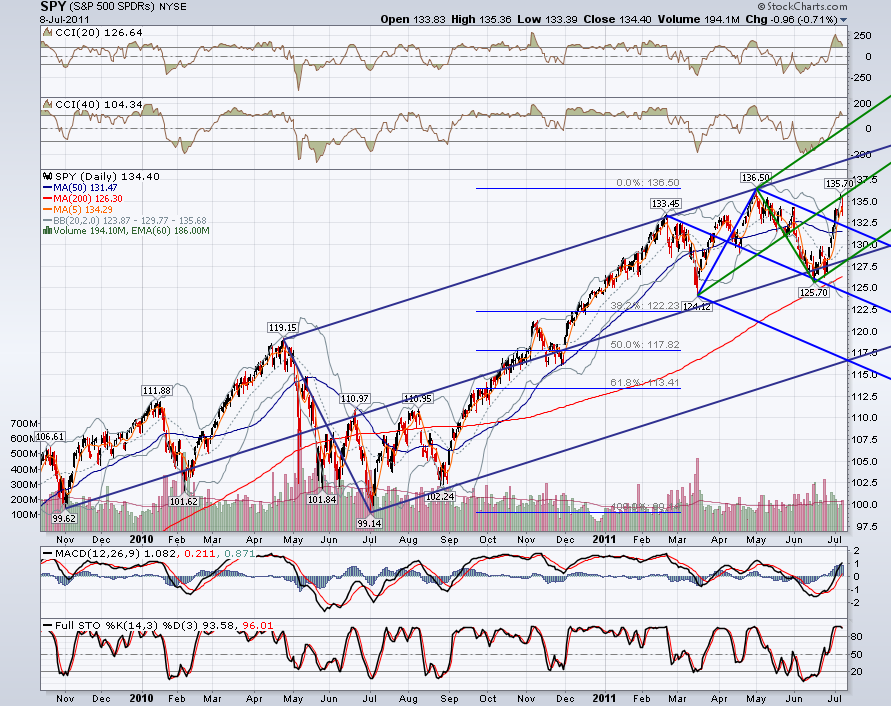
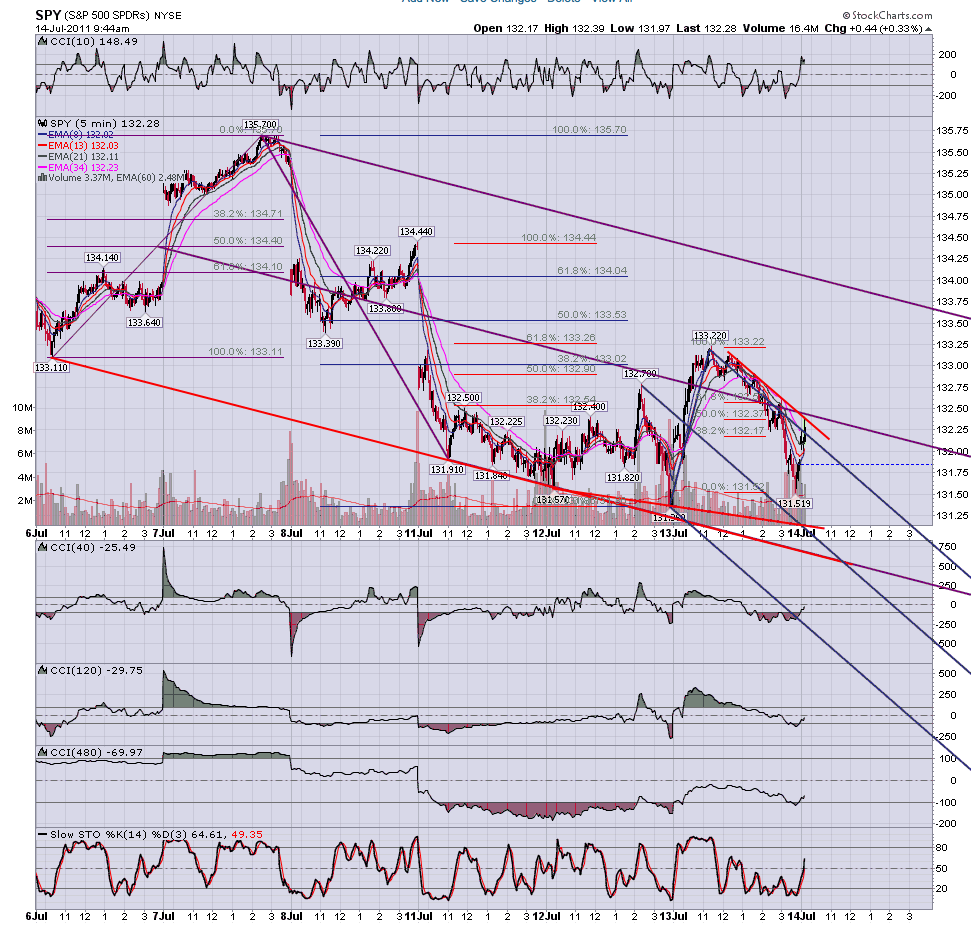
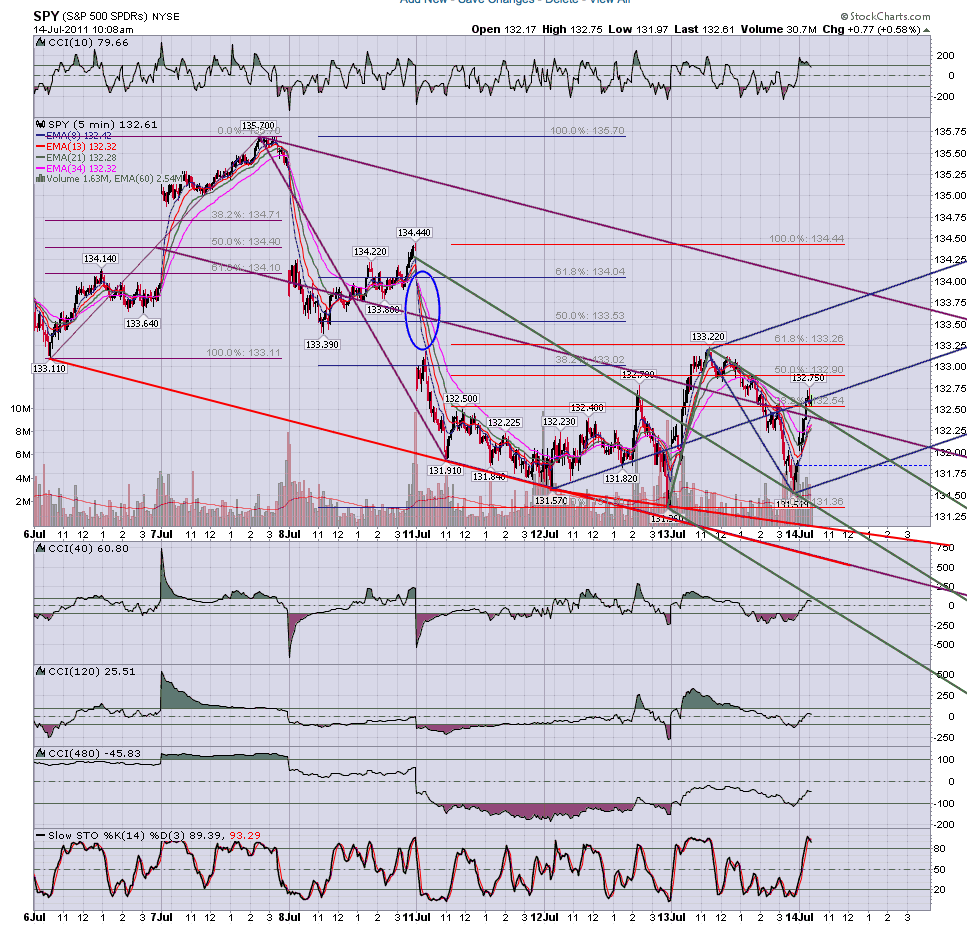
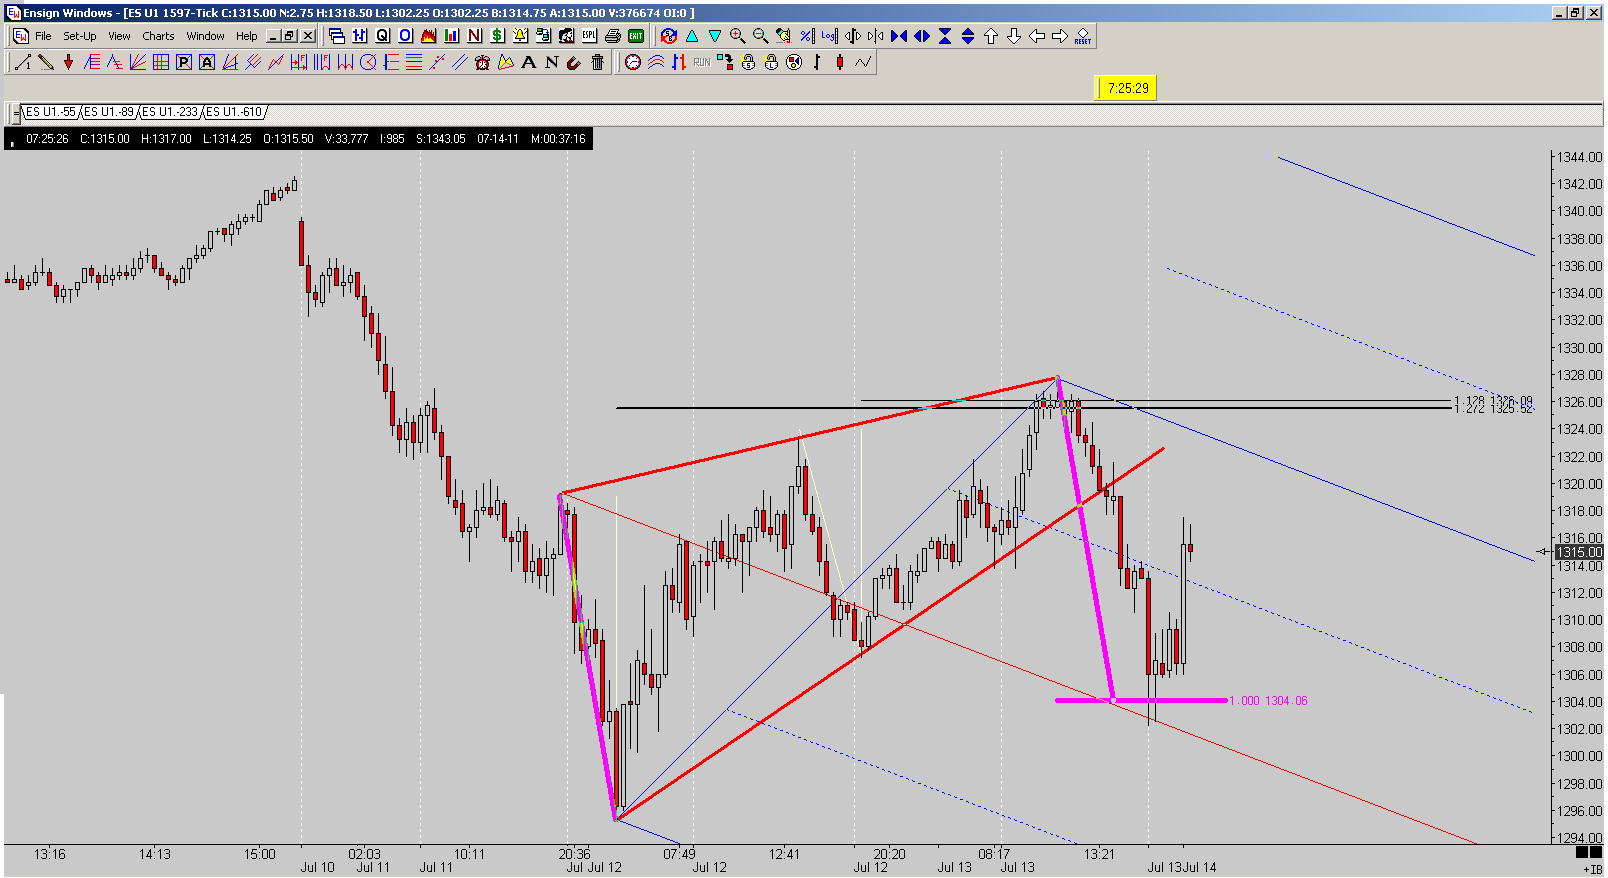
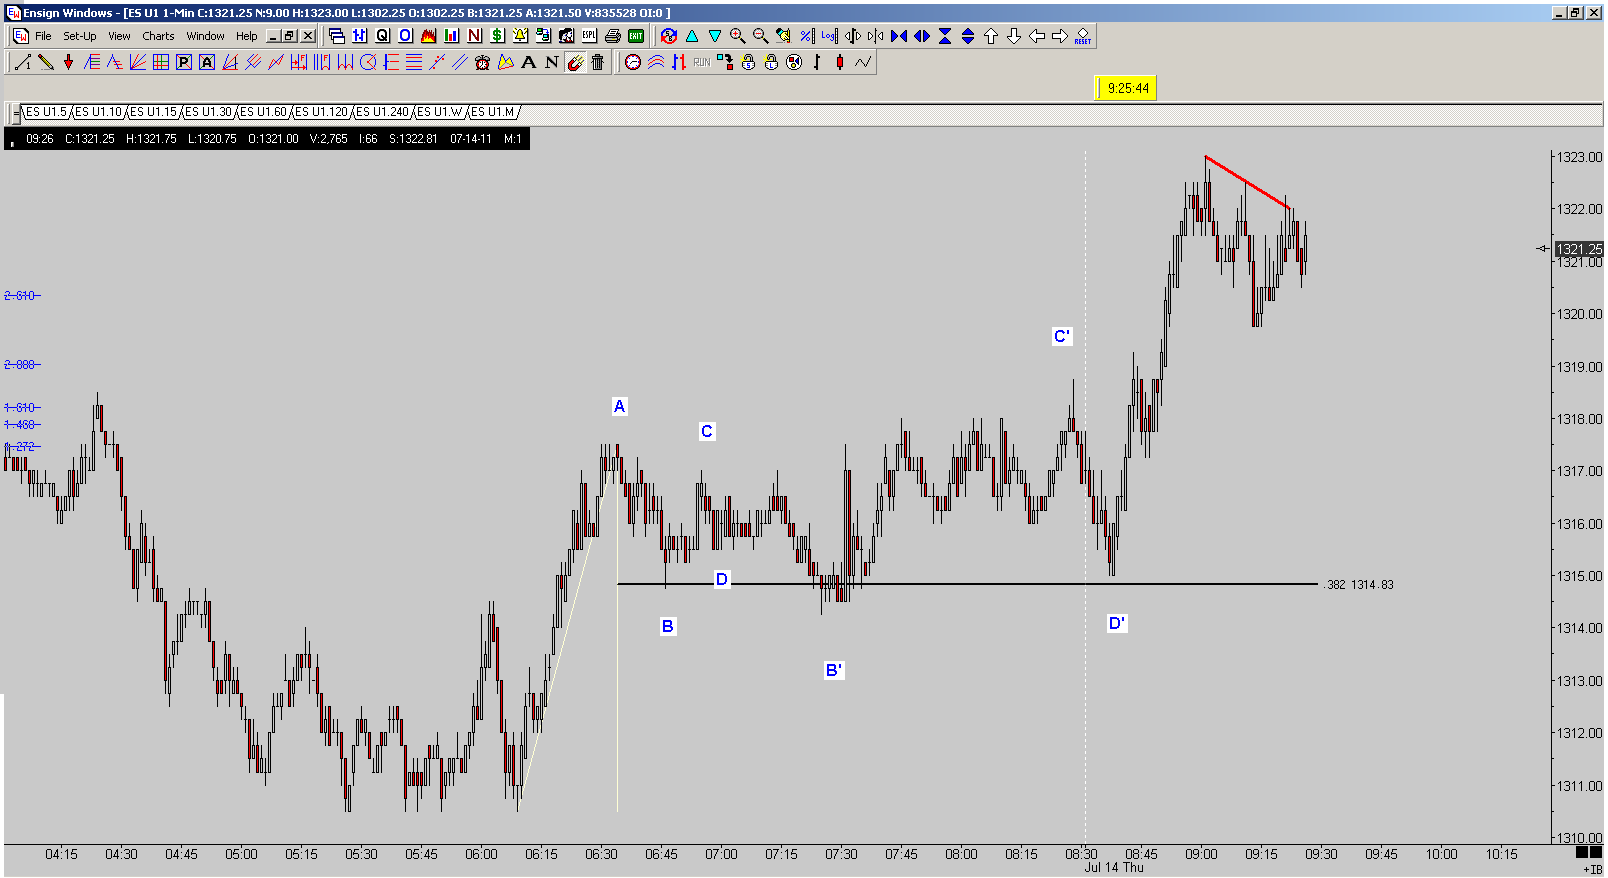
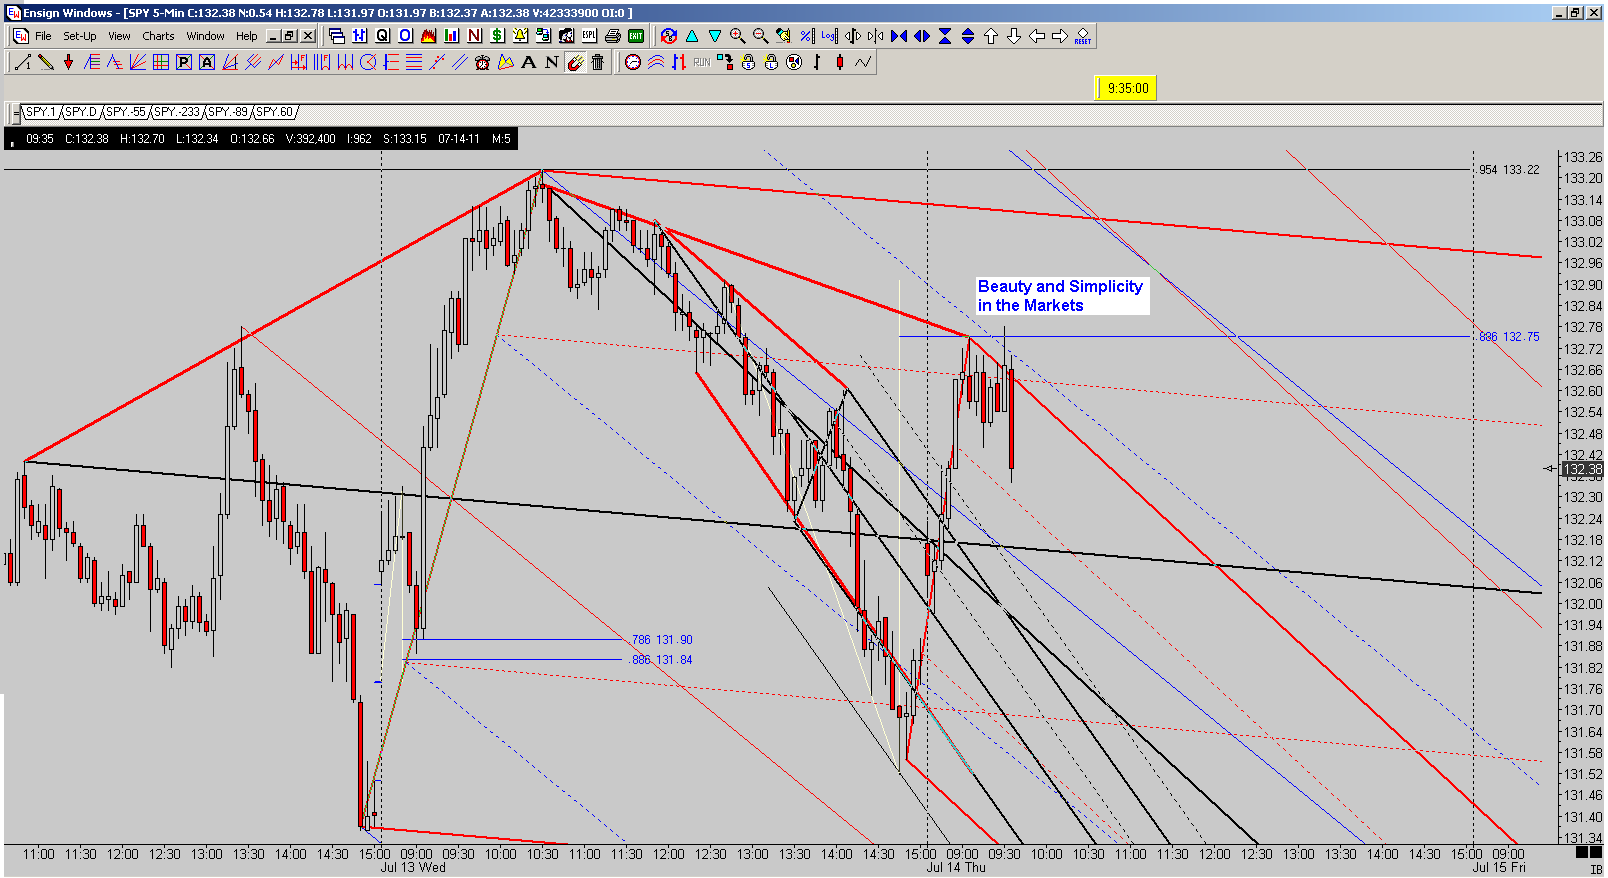
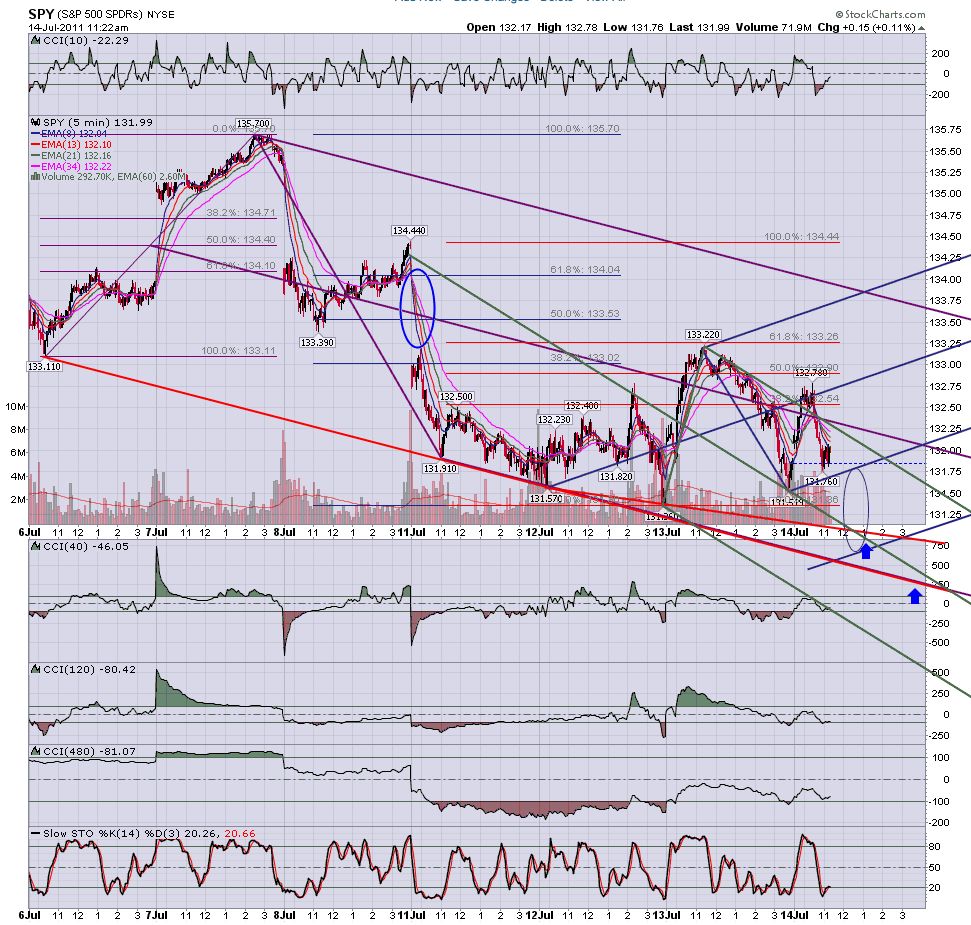
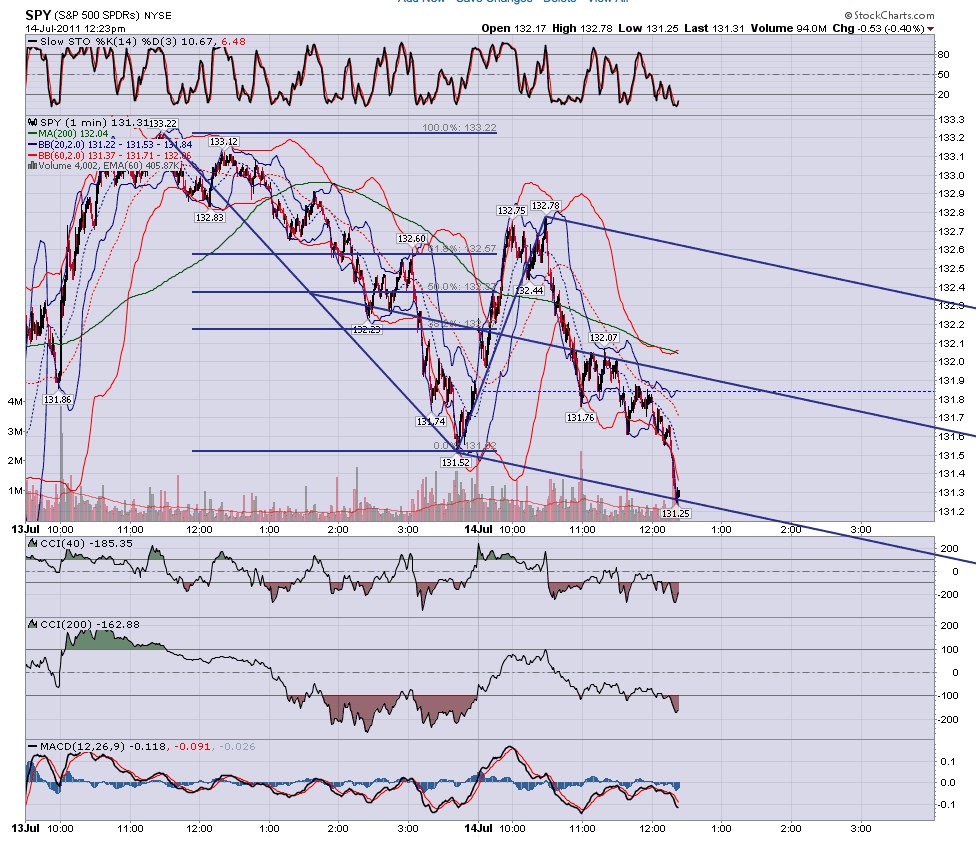
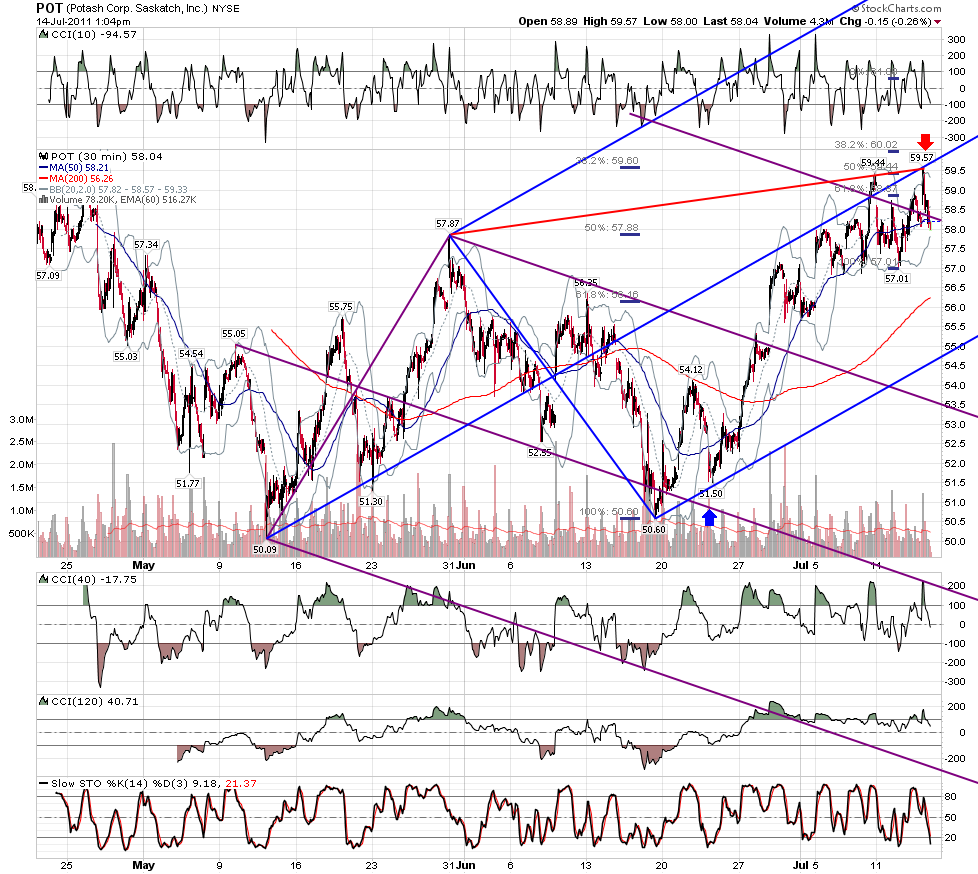
Okay, so it rose to 18.50, and checked back a full eight points, then rose to 23.25, and has dropped over twenty points so far. Not too bad, as far as levels posted well in advance. The point is, I post these levels so people can do their own studies and see why I am looking at the areas I am. Some areas (like the highest area I posted) don't get reached, some get run right through. From an educational standpoint, that doesn't matter. What matters is why/how I came up with those areas.
If you don't figure that out and move on, you miss the value of the post. I feel the most bang for the buck anyone can get in here is to study say the last six months of my posts, day by day, and recreate the work to see each and every level I post, and understand how I did that.
It doesn't matter if you do intraday trading, or trade only off weekly charts. I feel the methodology is fractal, and what I do with the mini's is pretty much the same as what I do with monthly charts (as I mentioned elsewhere, there are certain modifications I make because of time of day, intraday range, etc., but the setups remain basically the same). Studying my mini levels should produce basically the same concepts on higher timeframe charts. In this way, what I post is for just about everyone.
Originally posted by jimkane
Just doing my usual bathroom stop and check the charts. Futures now up, 12.50 points off the low. Like I thought this was going down. Yeah, sure it is. My levels on the way up are the ABCD here at 14.25 for the 1.000 (not thinking there is any chance that will slow this down), 18.75-19.75, 23.75-24.75, and then around 34.50-35.75. These are the center of the areas, give or take.