ES Thursday 7-14-11
Just starting the thread today as no one has and 0830 EST with its three reports is almost upon us.
My immediate levels are 1318 and 1312 followed by 1307 and 1301.
My immediate levels are 1318 and 1312 followed by 1307 and 1301.
1311.00 filled heading into a week of fishing next week. We'll see about tomorrow.
Good luck to all!
Good luck to all!
Lisa did an excellent recap of how she uses the footprint for me in last thursday or fridays thread. She uses point and figure type of charts set to a period of 5 and she decides to either jump on board when she sees big traders or wait for the retest. Read the thread for the specifics. It was a very well done explaination
I am a footprint "virgin" who has seen the footprints over the years but never gave any real effort to using them. That has changed for me now. I define my areas to do business the same as I always do and then look for clues with the footprint and the delta. My additional research is to attempt to filter out the "signals" to see if I can get a better picture of volume and delta by comparing the large and small traders. I'll let you know how that effort goes.
If my hypothesis is correct then most of the best and biggest moves will happen when we have participation from the large traders. That is logical and makes sense but there will also be smaller moves without the big traders involved. If I get signals from the big traders then it may be a better idea to trade for a longer move.
I just don't have the time to trade and post my footprint charts right now. It's a bit stressful just getting use to the new visuals. Hopefully over time I will be able to get some meaningful charts posted.
The other thing I should mention is that I am using a 1 point range chart. So a new bar only displays after one point trades. That cuts down on a bit of the noise. The thing I specifially like about them is this:
Suppose I get short below a one point range bars low...then I know that the next full bar cannot take out the swing high of my entry bar. It's just mathematically impossible. So I can watch to see if the close of the bar I have entered on is "good". Meaning that it closes down in my intended direction. An up close with good volume and high delta can be the quick exit for a small loss on a short trade entry . This allows me to make many trades if needed and the if context is still valid.
I hope that helps and good luck fishing!!
Originally posted by Big Mike
Originally posted by BruceM
Paul..the new summer time style is waiting for something to happen with the footprint inside the key zones I have defined ahead of time.....I'm trying to limit the add on trades etc...so these real time trades are taking more tries in the zones...obviously the air pockets get factored into the trade idea...
so i waited until I saw something happen with the footprint up there in my zone...I'm not gonna waste the forums time with posting the footprints as I don't beleive there is interest and that's ok...it takes too much timeOriginally posted by PAUL9
Bruce,
are you saying that you are starting to short right now, but you would like to see price move up to yesterday's RTH H, or yesterday's RTH swing H failure 23-24 area?
Bruce,
I appreciate the footprints that you and LisaP post. Am I correct in assuming you are using the footprint similarly to Lisa? Develop your areas of interest and then look for a footprint signal indicating what you were anticipating is actually poised to happen around those areas?
This seems like a very nice use of the delta IMO.
Good luck to all!
This may seem like I am blowing my own horn and I am...LOL...But the real take away from this idea is that these low volume areas get tested once broken. Today we broke the low volume of the 1310.50 and traded down to 1307.75..then we traded back up to a high of 1311...you will find this at the extremes of these low volume areas and I always assume that the average retail trader has stops in the 2.5 - 5 point zone....so u can see how they push out their stops ( many would have tried to buy at 1310.50 with a 2.5 to 5 points stop) so at 1308 those low capitalized traders get stopped out....so their buying back leads to the retest back up...hope that makes sense but more importantly watch some of those low volume areas..
we are at a very interesting point down near this 1302.50...we have potential single prints once again into the 1306 area and the key rat at 1300 on an option expiration thursday..seems a bit early for the real selloff so I am assuming the 1306 will retest soon
we are at a very interesting point down near this 1302.50...we have potential single prints once again into the 1306 area and the key rat at 1300 on an option expiration thursday..seems a bit early for the real selloff so I am assuming the 1306 will retest soon
Originally posted by BruceM
Good luck today...1310.50 is key support for me as it is a low volume area from the overnight...if they blow through it on the downside they should pop back up to retest it from below in the day session. I still like the weekly open print up in the 23 - 25 area as resistence..
13:26 14Jul2011 DJN-DJ WHITE HOUSE SAYS BOTH SIDES AGREE ON
$1.5 TRILLION IN CUTS TO DEFICIT
13:27 14Jul2011 DJN-DJ WHITE HOUSE SAYS IT BELIEVES BOTH SIDES
CAN AGREE TO ADDITIONAL $200 BILLION IN CUTS
13:29 14Jul2011 DJN-DJ CORRECT: WHITE HOUSE SAYS BOTH SIDES
AGREE on $1.5 TRILLION IN CUTS TO SPENDING
$1.5 TRILLION IN CUTS TO DEFICIT
13:27 14Jul2011 DJN-DJ WHITE HOUSE SAYS IT BELIEVES BOTH SIDES
CAN AGREE TO ADDITIONAL $200 BILLION IN CUTS
13:29 14Jul2011 DJN-DJ CORRECT: WHITE HOUSE SAYS BOTH SIDES
AGREE on $1.5 TRILLION IN CUTS TO SPENDING
Originally posted by BruceM
I just don't have the time to trade and post my footprint charts right now. It's a bit stressful just getting use to the new visuals. Hopefully over time I will be able to get some meaningful charts posted.
Thanks as always Bruce! I know how difficult it is, I've posted 2 live trades today and yesterday w/o a chart-LOL.
While it was tough for me, it actually helped me be "distracted" in the trade and let it work.
Good luck to all!
that came through the wires although i have not seen anything else to confirm it...
in any case, the spending cuts are much smaller than the $4tn they were talking abt before...
spike up as expected when the news came out but now it seems the market has taken it with skepticism
in any case, thought it might help someone
good luck
in any case, the spending cuts are much smaller than the $4tn they were talking abt before...
spike up as expected when the news came out but now it seems the market has taken it with skepticism
in any case, thought it might help someone
good luck
Originally posted by apk781
13:26 14Jul2011 DJN-DJ WHITE HOUSE SAYS BOTH SIDES AGREE ON
$1.5 TRILLION IN CUTS TO DEFICIT
13:27 14Jul2011 DJN-DJ WHITE HOUSE SAYS IT BELIEVES BOTH SIDES
CAN AGREE TO ADDITIONAL $200 BILLION IN CUTS
13:29 14Jul2011 DJN-DJ CORRECT: WHITE HOUSE SAYS BOTH SIDES
AGREE on $1.5 TRILLION IN CUTS TO SPENDING
here is how we put in that morning high into the key zone...we get the delta divergence in the lower pane and the false breakout of the highs that turns deep red as it rolls over...we also had air pockets below too !!..
Click image for original size
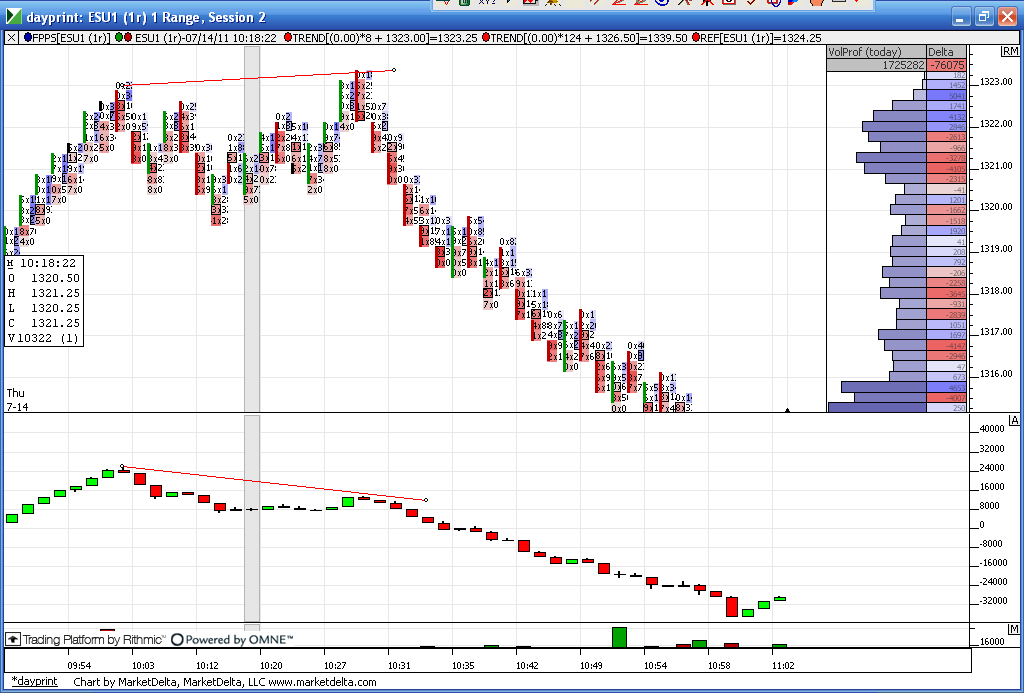
One time framing is setting up a sell @ 1311.25, but I think it will chop around the rest of the day, so I'll pass.
here is how it looked heading into the 1302 lows.....smart folks will now where the Overnight low was also...but look at all the volume on the red side...then we get a low with green delta ( lower pane) and only 945 shorts on the lows compared with the large numbers they had leading into that low....cool to see that retest on the 13:26 bar...only 31 sellers and then it's off to the races higher..look how delta even stayed green on the 13:25 bar
Click image for original size

bigmike, may be i am confused but wouldn't the 2.30pm et bar indicate a long based on the swing low at 1pm et ? of course that long would have gotten stopped out just now
the sell signal you are talking abt is based on what swing high bar?
the sell signal you are talking abt is based on what swing high bar?
Originally posted by Big Mike
One time framing is setting up a sell @ 1311.25, but I think it will chop around the rest of the day, so I'll pass.
Now that the trading day is done, I've given some thought to how in my mind I structure a day like today or rather how I try to think through a pattern to the day based on where we are in an hourly trend / daily trend.
So, things I keep in mind, we were in an up trend for the last couple of days. This would give me a check in the short bias box.
Three 0830 reports and not much happens. We are near the highs of the day. Another check in the short bias column.
It is only Thursday. This is a check in the "Probably going to stay in the last couple of day's range and have no explosive moves up or down beyond the established high / low of that range" column.
Now, based on the above, a sell at 1318 today looking for 3 - 5 points was in order. It could even be argued that if you were inclined to focus on taking only 1 - 2 best trades of the day that a sell there, followed by a separate ATM order to buy at 1305 or so were the two trades to take today.
I also traded the levels I posted in my first post to start the thread today, but that is much more complicated to explain. It involves a minimum of 4 lots, an ATM strategy with profit target, auto break even stop plus auto stop adjustment, and discretionary lifting of lots prior to the break even stop getting hit etc etc.
The above S/R trades are initiated based on how many times has the S/R been approached, what is the tape telling me, what is Delta Buy / Sell volume telling me etc.
Emini Day Trading /
Daily Notes /
Forecast /
Economic Events /
Search /
Terms and Conditions /
Disclaimer /
Books /
Online Books /
Site Map /
Contact /
Privacy Policy /
Links /
About /
Day Trading Forum /
Investment Calculators /
Pivot Point Calculator /
Market Profile Generator /
Fibonacci Calculator /
Mailing List /
Advertise Here /
Articles /
Financial Terms /
Brokers /
Software /
Holidays /
Stock Split Calendar /
Mortgage Calculator /
Donate
Copyright © 2004-2023, MyPivots. All rights reserved.
Copyright © 2004-2023, MyPivots. All rights reserved.