I decided to post my few comments on my levels in a separate topic so it doesn't get lost. There are just a few observations I have made on my levels, and thought they'd be helpful.
First, by now everyone should have noticed almost always my first level is for an ABCD. Many times one should notice it only gets to my first level, then rolls over. A lot of times that says it is reacting to the first place it can, the ABCD. That implies, to me, trend strength.
Now, if an ABCD blows out, what do I usually say? Looks like a 'W3' to me. So, go back to your Elliott texts and work and see where 'W3's' usually go to. See if that fits with lines and .382's and .447's, and all the other things you all know I look for. There's level two. I expect a checkback there, and depending on the overall layout, it may end there (yes, many runs end at the end of 'W3', and no 'W4' and 'W5' happen at all, sorry all you Elliott wavers, but the market does what it does), or it may continue.
If a checkback occurs and it is then going up to a 'W5' point, where is that likely to be? There's my next level. Always? Heck no. I am watching where the lines come in, where the .382's and .447's are, or other Fibs if that is appropriate, I am using all my work. If things come together in one spot, then it's a level. If not, then I don't have a level. I am, as always, looking to see if all the concepts produce clear confluence levels. If they do, then I have my levels. If not, I don't.
Here's a key observation that's I've made about my levels, and no one has pointed it out (which is disappointing to me...). Sometimes I see a lot of turns at the first level. That implies trend strength to me. If it can blow out that ABCD (sometimes it not an ABCD, but it is still the first level), or whatever the first level is, the trend needs a bigger correction, or it may be done. If it can get to the third level, it is really going counter-trend for quite a while, and I note that.
Notice, too, though, how it seems rare the third level is taken out without some kind of a good-sized reaction. That is very useful information. Sometimes it happens, but not too often in my experience. So, what you have are three levels that each have specific significance, and fit into a bigger picture of how I evaluate what is transpiring. It's more than just levels, it's about what is unfolding. There are lots of clues in how it handles the levels. Study this.
Now today I commented in the intraday trading topic about how the levels weren't all coming together in confluences like I'd like. What was falling out? The key .300's, .382's, .447's, and so on. They were doing their own thing, not hitting with everything else. And the lines I wanted to see, they were not happening either. So, I had general ideas, but nothing really clear.
And where did it turn? Between my two key levels that I posted. And what was there? The most important .447 was right between my two levels, a clear warning sign for me. It was at 1148.50, and the high was 1149.00, and it dropped 29.50 points hard right off that. I had to be ready anywhere in there, because the levels were not as distinct as usual.
I only posted them, in haste as the action was furious, because I knew some key levels were coming into view. But I also knew they were not as distinct and clear as those I usually work with. Whether this is a market distortion because of the extreme volatility or not I can't say. But we have to trade the market as it is, and I have to decide what is clear enough, and what is not. How much has my edge formed, and is it good enough?
To me that's trading reality, and I try to talk about this in the forum, and get discussion going, but it doesn't seem to happen. Setups are a dynamic process with lots of moving parts, and at best I holistically look at all the components and see what the score is, and see if that meets my minimum criteria. It's a subjective process, and I wish there were more written on it out there, but there isn't. Nothing about what I do can be clearly quantified and then it is obvious that it is 'good enough'. It's based on experience and holistic scoring, using specific criteria. I hope this helps.
TO
TonyC
Rep: 99
Posts: 471
At areas of interest, you can 'read' the flow and character of the price action. Getting a feel for the pace and liquidity of the trading at the time can also help refine the probabilities for a favorable outcome in my opinion.
Jim, about your levels, are you alluding to different time frame layers where each PTAs are coming from higher and higher time frames? if that's the case, I would think that the traded time frame has to be shifted to represent the correct traded time frame and context. Currently, I am working off of areas that are defined by the dynamic flow of the price action on the context time frame using visual representations of statistical methods then I construct more precise areas using our more common pattern setups(abcds or single legs) on the traded time frame to fit it all together. I have my own set of proprietary tools and methods to define my levels and it very often converge with Jim's fib pullback levels to form an area of synergy. Linear Geometry isn't necessary in my work but can be supporting factor sometimes. I have learned to cope with non-linear situations and have adapted my method to deal with distortions and curves. I cannot disclose the specifics but I'd like to invite forum members who are interested in this to do some research of their own. All I can say is, by seeing the price action in a more non-linear fashion is closer, in my opinion, to market reality. Linear geometric tools will point out areas only 1/3rd of the time but can mislead the trader the other 2/3rd where any projected area using line work(even adjuted MLs)will look like price action fails to get there or just blow past the box therefore possibly invalidating any entry trigger when there are actually other significant areas the line tools can't converge to, leaving the fibs groupings areas without line 'support'. Sometimes there is synergy with fib areas,not from line methods but sometimes from statistical methods or even volatility tools etc, to name a few. There IS synergy at odd areas too that the line tools can't show us.
Good luck deciphering my mumbling, sorry. But I hope that can lead to more profound understanding.
T
RO
roofer
Rep: 3,689
Posts: 3,574
by amen i mean this... the trader joed, who i do not worship, said to me many years ago.... the geometry does not exist without the non linear... then for almost a year he showed me charts with no lines..
RO
roofer
Rep: 3,689
Posts: 3,574
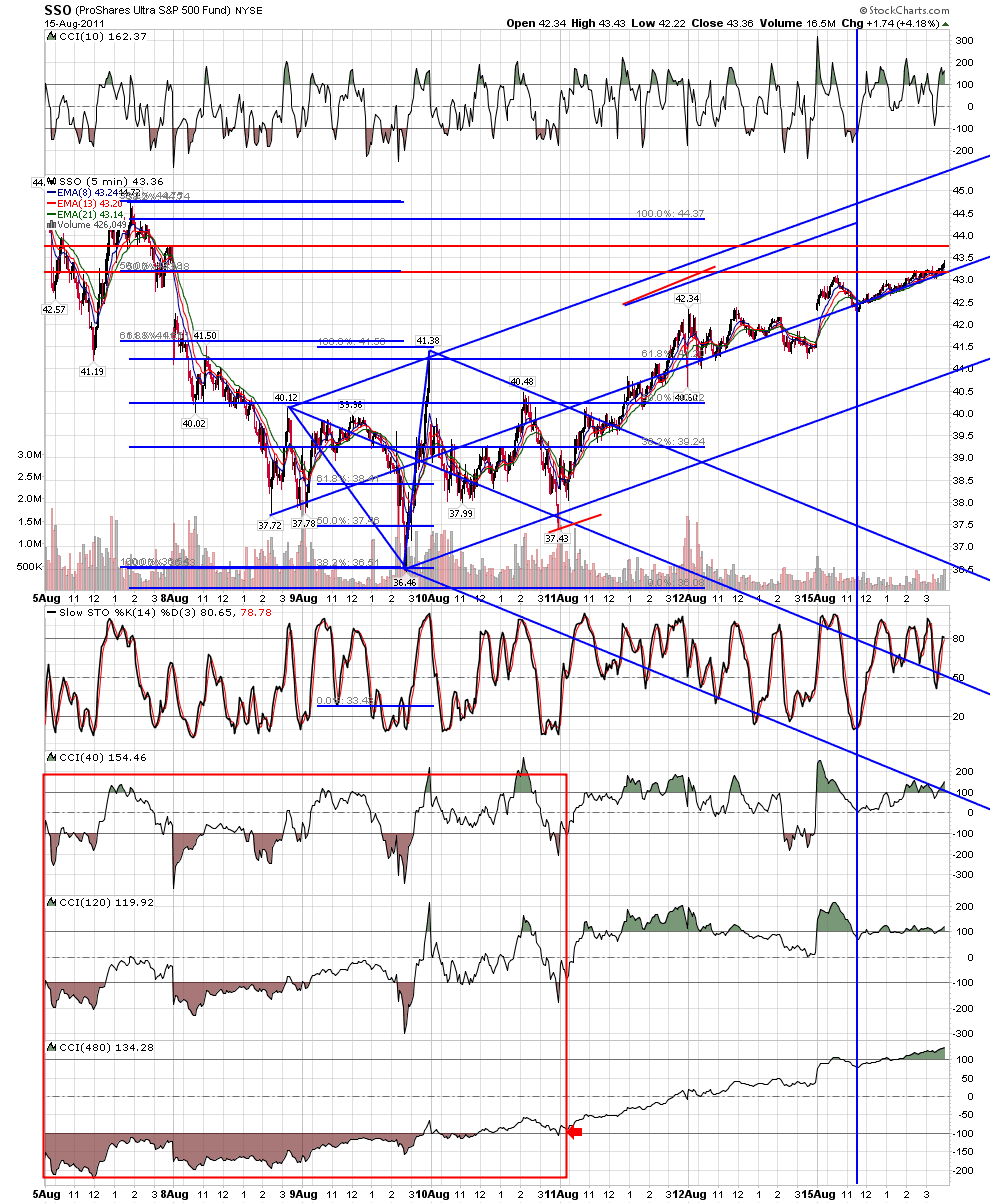
and from what joed showed me, i adapted my current indicator setup.... that is not his. . the indicators are linear only their levels. the computers we trade against can calculate the non linear across all stocks in milliseconds.. we can not...but it is in our grasp to visually say what we see... indicator action in red box is classic big move setup.... at blue line... another high needed
Click image for original size
TX
tx_ches
Rep: -10
Posts: 514
Thanks for posting the chart, roofer. A visual always helps to firmly grasp the concept.
RO
roofer
Rep: 3,689
Posts: 3,574
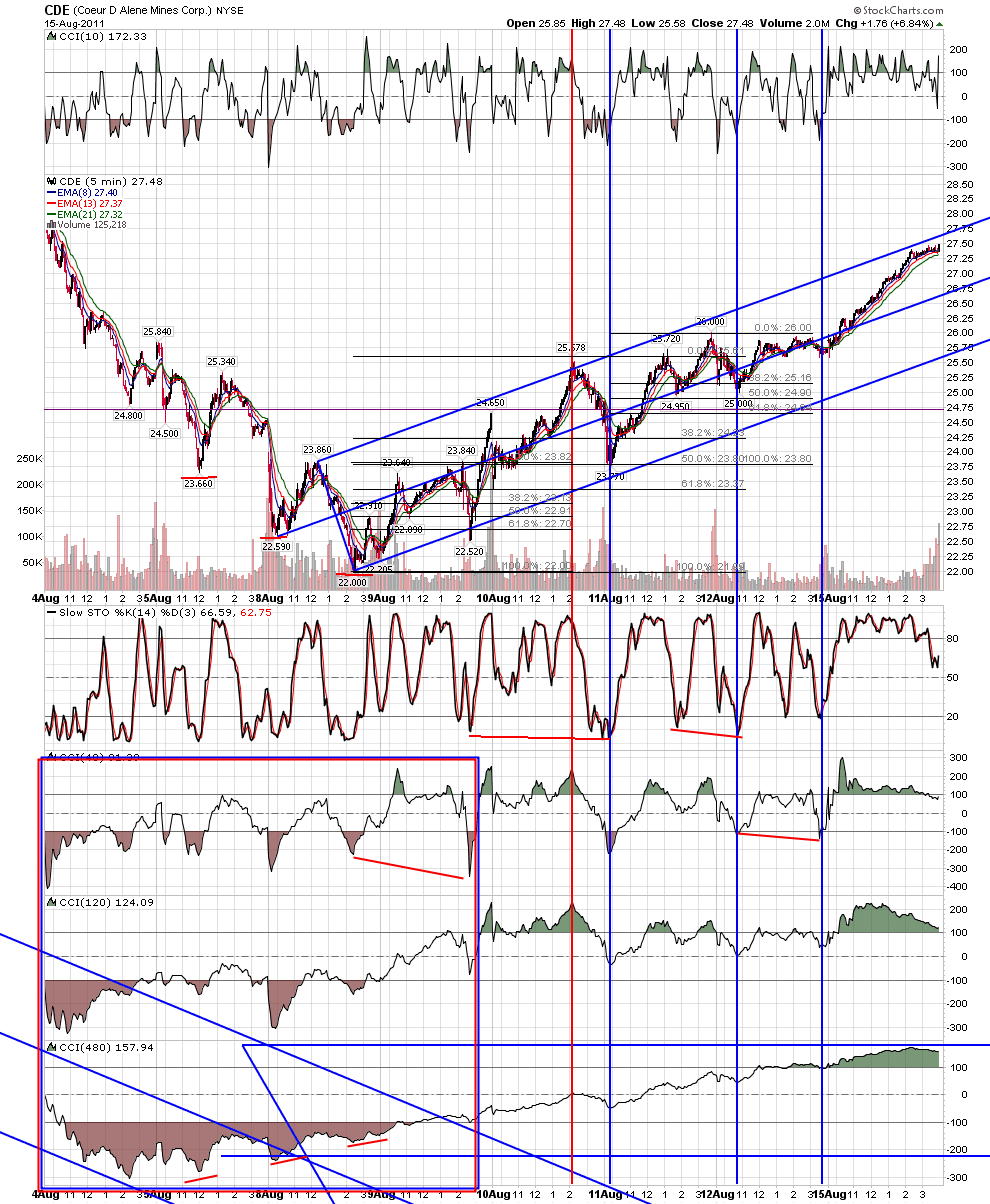
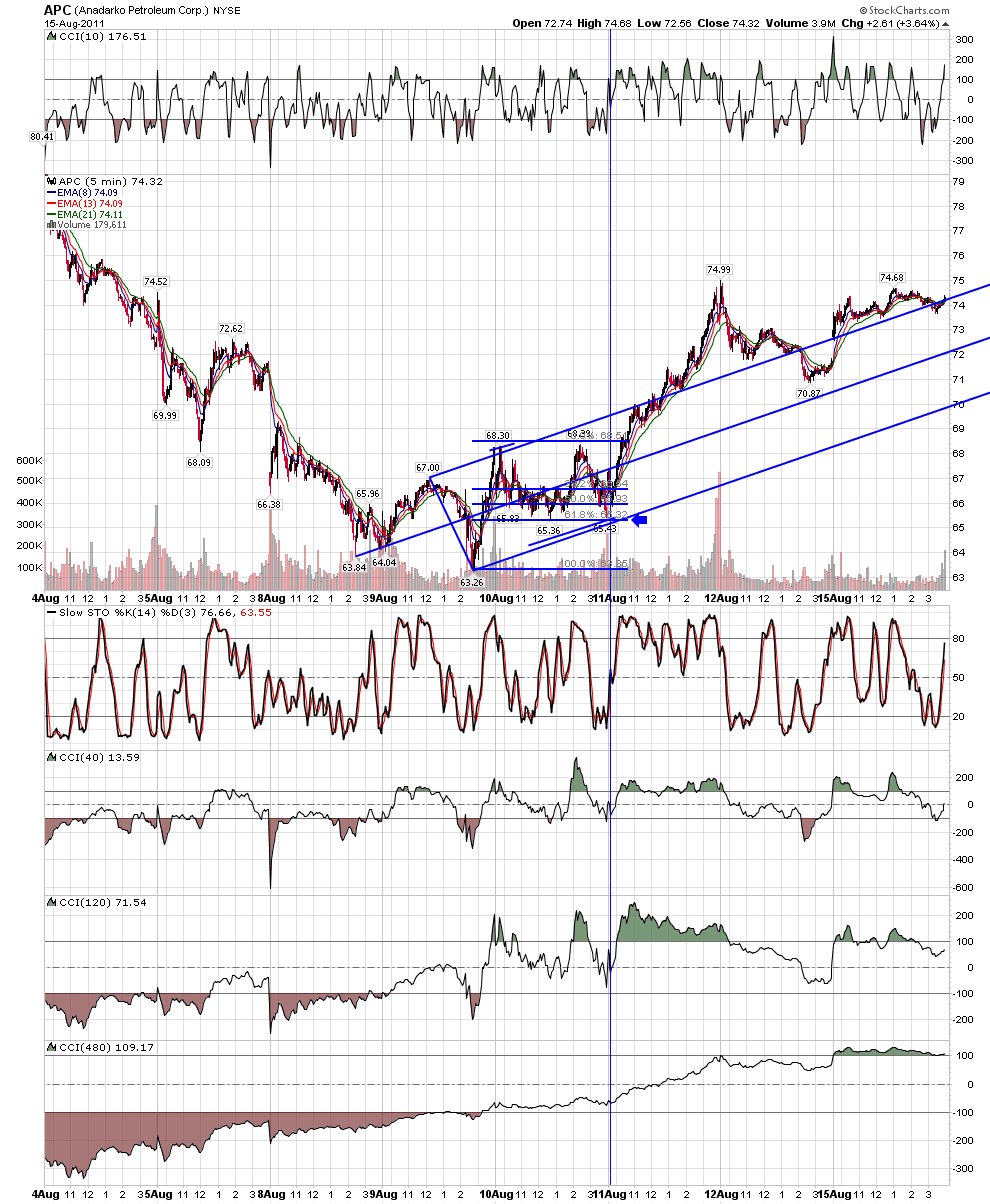
here is another....big move box..... then pullback, push, push, push... basis the non linear..my mind is trained to see the indicator setup in a split second.. in the heat of trading if non linear conflicts with linear.. i pause..a careful use of the tools of this forum in conjunction with the non- linear generated a number of trades....a note on price action....yesterdays was classic of what i have called ticking...for a decade.. in the trading room they call it pebbling.. this is something that i can not teach.. all i can say is do your own work.
Click image for original size
RO
roofer
Rep: 3,689
Posts: 3,574
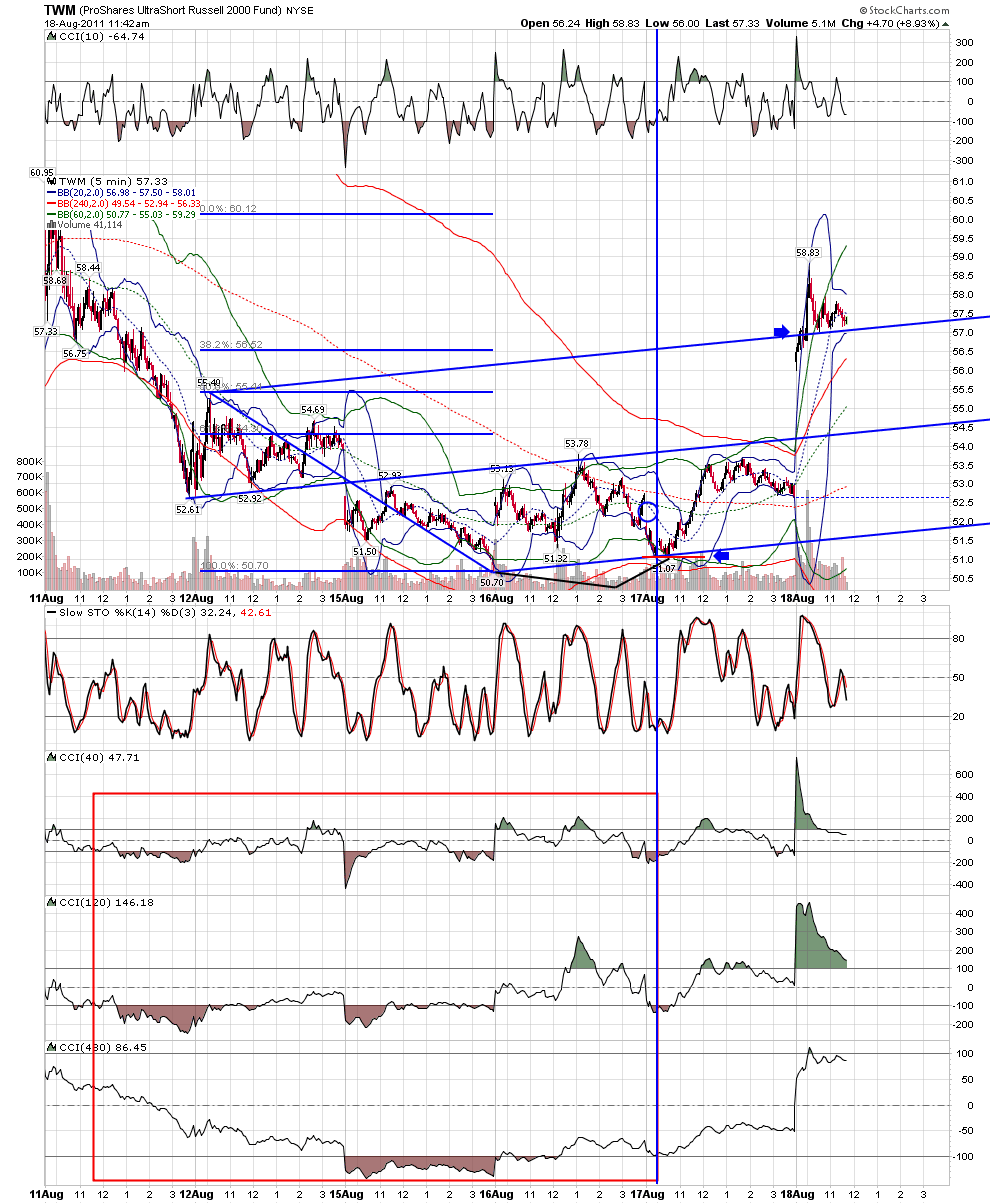
ches/rat you seem most interested in the non linear.... LOOK!!!!!!! at where the cci 480 was in previous charts AFTER!!!! CCI40 AND CCI120 HAD CYCLED TO 100...!!!!!now look where the cci480 was RIGHT AS THE .886 ON GAP ON 5 AT GEO SET UP!!!!!!!!you could talk with joed until you are blue in face.... but this is the essence...
Click image for original size
TX
tx_ches
Rep: -10
Posts: 514
Withdrawn.
Originally posted by roofer
ches/rat you seem most interested in the non linear.... LOOK!!!!!!! at where the cci 480 was in previous charts AFTER!!!! CCI40 AND CCI120 HAD CYCLED TO 100...!!!!!now look where the cci480 was RIGHT AS THE .886 ON GAP ON 5 AT GEO SET UP!!!!!!!!you could talk with joed until you are blue in face.... but this is the essence...
RO
roofer
Rep: 3,689
Posts: 3,574
we are often most critical of that which we fear most in ourselves... note the nature of bruce m. posts today.out of control..not tolerating any differences or questions.joed always said that forums self destruct in such a way... i feel bad for our generous host having to watch this....