I decided to post my few comments on my levels in a separate topic so it doesn't get lost. There are just a few observations I have made on my levels, and thought they'd be helpful.
First, by now everyone should have noticed almost always my first level is for an ABCD. Many times one should notice it only gets to my first level, then rolls over. A lot of times that says it is reacting to the first place it can, the ABCD. That implies, to me, trend strength.
Now, if an ABCD blows out, what do I usually say? Looks like a 'W3' to me. So, go back to your Elliott texts and work and see where 'W3's' usually go to. See if that fits with lines and .382's and .447's, and all the other things you all know I look for. There's level two. I expect a checkback there, and depending on the overall layout, it may end there (yes, many runs end at the end of 'W3', and no 'W4' and 'W5' happen at all, sorry all you Elliott wavers, but the market does what it does), or it may continue.
If a checkback occurs and it is then going up to a 'W5' point, where is that likely to be? There's my next level. Always? Heck no. I am watching where the lines come in, where the .382's and .447's are, or other Fibs if that is appropriate, I am using all my work. If things come together in one spot, then it's a level. If not, then I don't have a level. I am, as always, looking to see if all the concepts produce clear confluence levels. If they do, then I have my levels. If not, I don't.
Here's a key observation that's I've made about my levels, and no one has pointed it out (which is disappointing to me...). Sometimes I see a lot of turns at the first level. That implies trend strength to me. If it can blow out that ABCD (sometimes it not an ABCD, but it is still the first level), or whatever the first level is, the trend needs a bigger correction, or it may be done. If it can get to the third level, it is really going counter-trend for quite a while, and I note that.
Notice, too, though, how it seems rare the third level is taken out without some kind of a good-sized reaction. That is very useful information. Sometimes it happens, but not too often in my experience. So, what you have are three levels that each have specific significance, and fit into a bigger picture of how I evaluate what is transpiring. It's more than just levels, it's about what is unfolding. There are lots of clues in how it handles the levels. Study this.
Now today I commented in the intraday trading topic about how the levels weren't all coming together in confluences like I'd like. What was falling out? The key .300's, .382's, .447's, and so on. They were doing their own thing, not hitting with everything else. And the lines I wanted to see, they were not happening either. So, I had general ideas, but nothing really clear.
And where did it turn? Between my two key levels that I posted. And what was there? The most important .447 was right between my two levels, a clear warning sign for me. It was at 1148.50, and the high was 1149.00, and it dropped 29.50 points hard right off that. I had to be ready anywhere in there, because the levels were not as distinct as usual.
I only posted them, in haste as the action was furious, because I knew some key levels were coming into view. But I also knew they were not as distinct and clear as those I usually work with. Whether this is a market distortion because of the extreme volatility or not I can't say. But we have to trade the market as it is, and I have to decide what is clear enough, and what is not. How much has my edge formed, and is it good enough?
To me that's trading reality, and I try to talk about this in the forum, and get discussion going, but it doesn't seem to happen. Setups are a dynamic process with lots of moving parts, and at best I holistically look at all the components and see what the score is, and see if that meets my minimum criteria. It's a subjective process, and I wish there were more written on it out there, but there isn't. Nothing about what I do can be clearly quantified and then it is obvious that it is 'good enough'. It's based on experience and holistic scoring, using specific criteria. I hope this helps.
TO
TonyC
Rep: 99
Posts: 471
really the spikes through the ML// near the 8:00am time were what bugged me the most...in realtime live trading, I honestly would know what to make of it other than not seeing this as a stable set.
JI
jimkane
Rep: 3,058
Posts: 33,089
Well, and I don't want to say to much in 'public', but that is the set I use the most often for my trading. I could care less about those spikes, I see them all the time and they are meaningless to me. I am not using the set to describe price action. I have done sets like this and had it move way out of the set, and that matters not to me.
What bothers me the most about that set is the anchor on the right not at the high. I'd want to believe what the set was based around was all part of the correction. If I felt that, I would use that set. For me, I found at least four other lines hitting this same area other than this really good set, using common techniques that are fairly easy, of which two have nothing to do with sets at all.
But, what I am wondering isn't whether or not there is linear synergy here or not, as I'm sure there are many examples where a great trade sets up and there isn't any linear synergy. I know you don't want to reveal too much of what you do, but I am wondering about something. You said: "...having supporting synergy with non-linear methods..." I see the clear pattern, there is a .382 and .486 overlap there, it looks like a great potential trade.
But, and be general if you have to be, what non-linear methods? You show moving averages, but not ones that would indicate that area. Indicators? I know there would be an indicator setup that would agree with this area. I really need to have some general idea why you think this area is a synergy, so I can see if I can indeed make some use of what you are presenting.
I will try to post a few charts showing some simple line techniques I would be using here, and that I think I would see quite easily in real-time (given I use them pretty much every day in a similar manner and see them without difficulty). Most of my advanced mentor students, I think, would see them.
Originally posted by TonyC
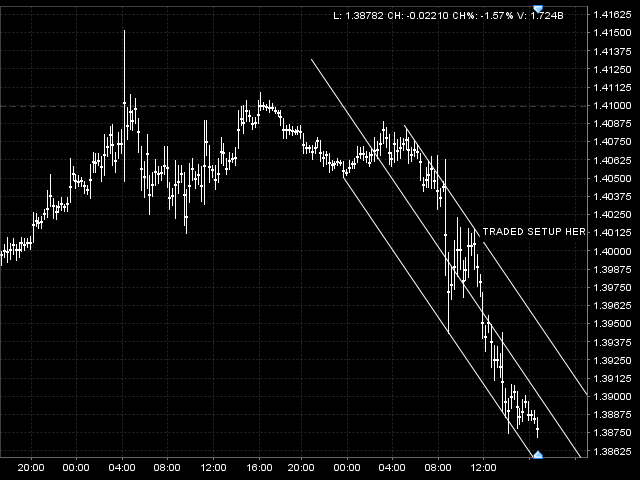
now the best ML set i could get was this one , but what do you do with the spikes through the ML //? offsets? or reflection lines?....it is still ambiguous...and wich framework to trust?...not a stable set IMO. but with some more creative ways you could actually get something but would that be a trustworthy set? a set that can be obtained on a consistent basis? I don't know but from my experience with this type of line construction I would have to say pass or just standby for another PTA...
Click image for original size
JI
jimkane
Rep: 3,058
Posts: 33,089
I guess you described your non-linear approach here. Unfortunately, and I'll be the first to admit it, I don't have even the slightest clue as to what you are doing or how I could follow up and study this on my own. Honestly, your description is so (purposefully) vague, I wouldn't even know where to begin. All I can do from here is say to myself it sounds like you are on to something fantastic, and go back to what I do. I wish I could know more, but if you felt you could reveal more, you probably would have.
As far as my levels, no, they aren't varying timeframe overlaps, they are just wave levels, syncing up with lines and the usual Fib work. Pretty simple, pretty basic, but they seem to work remarkably well for me, as far as finding areas.
As far as my levels, no, they aren't varying timeframe overlaps, they are just wave levels, syncing up with lines and the usual Fib work. Pretty simple, pretty basic, but they seem to work remarkably well for me, as far as finding areas.
Originally posted by TonyC
At areas of interest, you can 'read' the flow and character of the price action. Getting a feel for the pace and liquidity of the trading at the time can also help refine the probabilities for a favorable outcome in my opinion.
Jim, about your levels, are you alluding to different time frame layers where each PTAs are coming from higher and higher time frames? if that's the case, I would think that the traded time frame has to be shifted to represent the correct traded time frame and context. Currently, I am working off of areas that are defined by the dynamic flow of the price action on the context time frame using visual representations of statistical methods then I construct more precise areas using our more common pattern setups(abcds or single legs) on the traded time frame to fit it all together. I have my own set of proprietary tools and methods to define my levels and it very often converge with Jim's fib pullback levels to form an area of synergy. Linear Geometry isn't necessary in my work but can be supporting factor sometimes. I have learned to cope with non-linear situations and have adapted my method to deal with distortions and curves. I cannot disclose the specifics but I'd like to invite forum members who are interested in this to do some research of their own. All I can say is, by seeing the price action in a more non-linear fashion is closer, in my opinion, to market reality. Linear geometric tools will point out areas only 1/3rd of the time but can mislead the trader the other 2/3rd where any projected area using line work(even adjuted MLs)will look like price action fails to get there or just blow past the box therefore possibly invalidating any entry trigger when there are actually other significant areas the line tools can't converge to, leaving the fibs groupings areas without line 'support'. Sometimes there is synergy with fib areas,not from line methods but sometimes from statistical methods or even volatility tools etc, to name a few. There IS synergy at odd areas too that the line tools can't show us.
Good luck deciphering my mumbling, sorry. But I hope that can lead to more profound understanding.
T
TO
TonyC
Rep: 99
Posts: 471
Jim,
Im sorry I was being vague about the non-linear methods. I did it on purpose though. It was meant to raise members curiosity and see the interest level about that subject. And sorry, the chart example that I showed wasn't the best chosen one. Of course with good line tool proficiency as you and your students could construct a well defined PTA. that's not my point. In my attempt to show why/how a projected area often shows promise but then price action falls short or goes 'around' and past the area . That was a poor example I showed for that.My main reason for all this talk is to define wich line do you trust? do you trade the ML//? the warning // line? the inside//? the center line?...from a trade plan standpoint, how can you be consistent in your choice and decision to trade from wich line? you need supporting factor to filter out the lines that are less likely to provide enough probabilities for a profitable trade. For that, the straight lines tools aren't enough IMO.
The ML sets could be adjusted, re-re-re adjusted at will if one wants to do it that way of course. But what about "FLOW"? the price action has flow and character. A personality of its own,changing with each new flowing trends(or non-trend) if you think about it...IMO these changing flows are NOT linear in nature and that's where the straight line tools have their limitations. They need manual adaptation/adjustments and more layers of decision are then added to the already subjective nature of the discretionary styles. This presents a more difficult situation to deal with,such as more time to analyze, support/refute, verify the new information etc. My researches in that subject have taken me to a path where more dynamic tools are necessary. But to go that way, I had to first start with the straight lines and extrapolates to another theory, the 'relativity' one, after all if A. Einsten can prove that light can be bent,even ever slightly, then why not the straight line tools? please don't laugh. that's actually how I came about to think about a 'bending' effect in the ML tools...Since then I've made my own advancements and built my own set of non-linear tools AND adapted my trading plan accordingly. Jim, please don't see this as a challenge or a bashing of your methods, far from that. I am just exposing new ideas for anybody that's interested. These new ideas/concepts were borne from your Kane concepts and methods and I forever owe you for without Kane methods I wouldn't be on these new grounds.
I will try to formulate a post that will shows more specifics on non-linear tools. give me some time, I'll come up with something cool.
T
JI
jimkane
Rep: 3,058
Posts: 33,089
T, thanks for the reply. I don't take anything like this as bashing my work at all. I have found that many, if not most students don't use my work to any great extent as they evolve their own way. At best I teach them to think in a trading way, and then they do their own thing. So, I'm not sensitive to that at all.
I understand that your point wasn't whether lines could be found on this specific example. I have just not found what you have as far as the probabilities and such with the work I do. I also found a clue in your post that tells me how you think much differently than I do. Up until now I thought (and maybe in the past this was the case) that you were the only person who thought essentially exactly like I do. It's more than I can explain in writing, but I now see why you had to evolve in the direction you did, and why I haven't had to.
In the old days, when I first came out and showed my stuff, some eight years ago, I used to get one question over and over and over. Yeah, Jim, sure, you have all those Fibs, but which Fib is the 'right' one in a given situation? Finally, after years of work with students and teaching, and advancing my own work, I found the perfect answer to that. It was: 'If you understand the work, that is never a question that even comes up.' I find the same thing with lines.
You ask what seems like the mostly useful questions, do you use the ML, a division line, a //, this or that. If you spent one hour with me in real-time you would surely say (I think), Oh, I see, that's not even a question. I see what you do, what you look for, how you weigh things up, and when is a setup 'good enough'. What I do is very specific, and it essentially never has me wondering if I've got what I am looking for. When I have it, it's obvious. If it's not, I just pass. In my opinion, I rarely 'get fooled'. But, I can't explain it any better in writing than this. I could show it easily, live with charts, but not in words with static charts.
Let me also explain one thing I tell students all the time. This methodology can never tell me what the market is going to do, where it is going, or anything like that. At any given time it can't get me long or short. All it was designed to do, and I feel it does it extraordinarily well, is wait around until a set of conditions come together, and then I can act on those.
Most of the time I sit, clueless. Many, many fine moves come and go, many 'lost' opportunities, many which your techniques likely would find. I concern myself not with all that. I just sit and wait for my ducks to line up, and then I hit it. If I wanted to find other techniques that may find me more opportunities while I sit, I could do that. My goal isn't to find all the opportunities, it is to do very well with the approach I have. If I have too much time sitting, I just look at more issues.
Given that, I am always open to new ideas, better techniques, more opportunities, and so on. I would really like to see you put a post together explaining as much as you are willing to. I have a tremendous respect for your trading mind. But, I want everyone to understand that the stats T is finding as far as the lines, and the issues he has with them, I simply am not having. I can understand how someone might, but with the level I have developed with lines and the rest of the work, I just don't see them, the way I view the market.
TO
TonyC
Rep: 99
Posts: 471
okay Jim and members,
Here it goes, the world premiere showing of my non-linear concept in practical trading techniques.
This is a cleaned up version of the charts I am working with and only shows the concept,not the whole methods and other various trading techniques and strategies to take advantage of a potential edge there.
But the trading philosophy is to trade with the trend and the graphic representation of the current/flow is defined by the non-linear set of lines that you see on the charts.
These curved lines sets are calculated and generated dynamically with my own proprietary parameter inputs. You could say it is just another indicator similar to MA ribbons, envelops,Keltner, Bollinger Bands etc, thus implying lag time, implying nothing really new about it, therefore no perceivable edge can be gained from it. I'd say yes and no to that.
The main difference is the way you use it, the way to exploit it. The way I use it, in my twisted mind , those line don't give you any trading signals at all, no buy or sell signal like the common indicators out there. I just use them as a geometric device just like I would with a ML pitchfork. I see them as dynamically generated factoring in dependable statistical time values and price action flow and rythm as inputs among various other data. This ain't no mystical 'quantum' formula either. The main idea here is that I do TRUST this tool(well, because I designed it to fit my needs), therefore it is sufficient and necessary to my trading for synergy support of trading areas. As Roofer said, I do put my financial well-being at stake using this tool day-in day-out. It just works for me. That said, the main driver for getting to this point is to have stability and consistency in my chart analysis. By stability I mean reliable and clear areas to work with. That translates to consistent confidence in my trading decisions therefore improving my bottom line.Believe it or not.
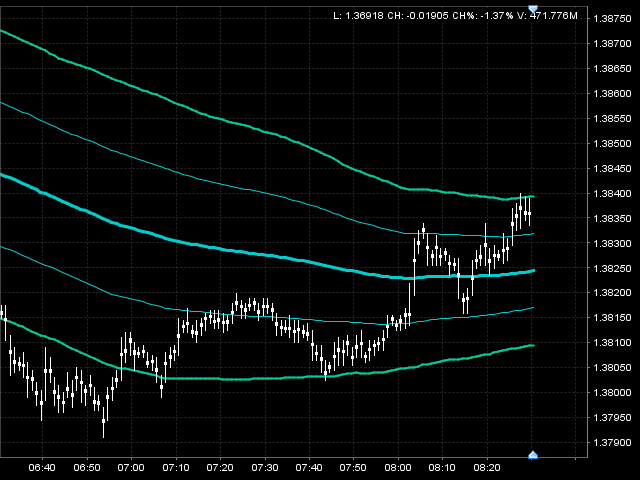
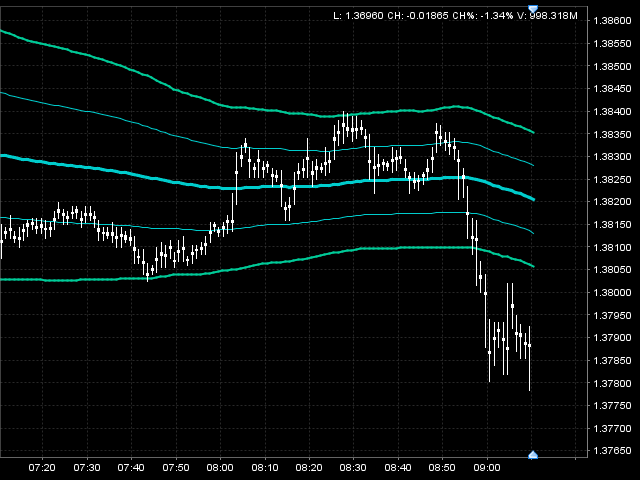
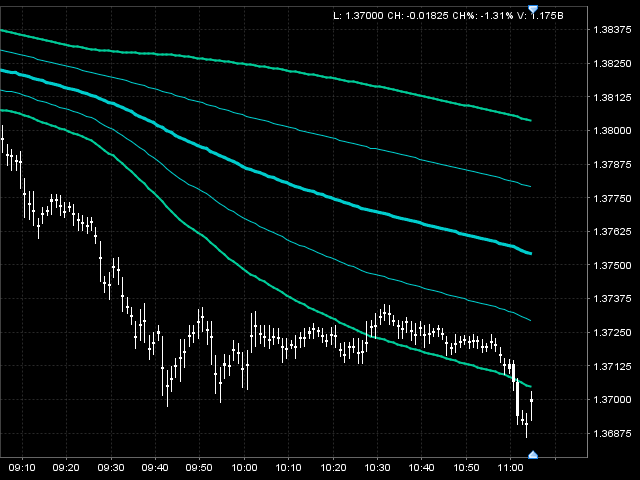
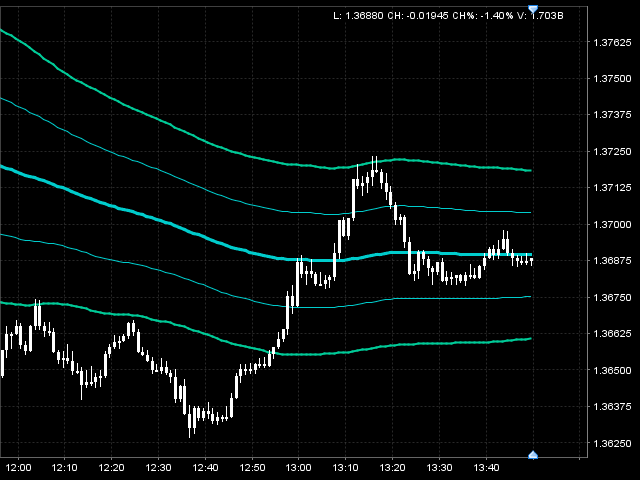
The 'warped' line set here describe the non-linear aspect of the flowing price action. So I named it : 'WARPED-LINES set' or 'WL set'.(should I trademark this?)
Looking at the charts, just note the price action interaction with the lines just like it does with straight ML lines. You can see there is definitely something going on from a technical standpoint, the line touches, the support or resistance games, the line creeps etc...
Now, what separates this from just using plain ol' ML sets,even the adjusted ML sets? my answer: the WL set actually are 'adjusted' dynamically, as in 'you don't have to move a finger' for it to work, your computer does the drawing for you so you can concentrate on other factors in your analysis, no more guessing wich anchor points to use, wich angle adjustments, wich offsets, wich spikes to disregard etc. The WL gives you like a 'best fit'ML set, similar to regression channels/lines methods. The 'width' and spacing of the lines are dependent on the dynamic parameter inputs from the price action data, so no manual adjustment here, too. That why you get that 'warping' effect.
This isn't the holy grail folks.
The edge is in the way you exploit this non-linear tool. I repeat, it's all about the trading plan. What you make of that edge is what matters.
Another properties these WL sets have is that it forces you to execute in the present, not in a projected manner. I mean the trading areas will manifest themselves as price action dictates. There is no extension of lines into the future time axis. Everything happens in the present as things unfold. Yet, it is leading you to a decision point. Yes it will be more reactionary than anticipatory. But it is actually a positive aspect IMO because this focuses your efforts in preparing your execution plan.
Wich lines to trade then? it's for the trader to decide when you're formulating your trading plan. I know wich one I trust and want to trade but it is specific to my own.
One can work the lines in a similar way as the Kane methods with type1/type2 cat1/cat2 tests etc to opposing WL or middle WL etc, just a suggestion here, not an advice or recomendation.
I hope this helps. I am not a teacher so I can't really make perfect sense in my posts but hope you get most of the ideas. These WL and non-linear concepts are just a fraction of the things I am working with as far as trading goes. I don't know how advanced or groundbreaking cutting edge this is but suffice to say I must give most of the credit to Jim Kane for his invaluable Kane methods. I use Jim's execution concepts and methods in my trading. Here I am just merely presenting a new tool, not a whole comprehensive set of techniques and strategies as Jim did in his work. I use 90% of Jim's techniques, I just differ in wich tools I am using to find my areas, to reassure everyone I am still a student and admirer of Jim's work, I just like to play outside of the box sometimes.
Check out the charts, This is a setup for a short trade,context and trend flow point downward, and the price action is retracing into my line areas, just like it does when it pulls back into a groupings and ML synergy area. Now imagine those WL as if they were straight ML lines... a picture is worth a thousand words...tell me what you think.
T
ps:I will not get into any deeper details about my propietary stuff,thanks for understanding. I will however keep participating in further discussions in the forum as time permits.
Click image for original size
Click image for original size
Click image for original size
TO
TonyC
Rep: 99
Posts: 471
here is another setup using non-linear.
The market is an abundant place...
The market is an abundant place...
Click image for original size
TO
TonyC
Rep: 99
Posts: 471
By the way Jim,
it was what you said in your MLFS book in the last chapter about market flow and rythm that inspired me to develop the non-linear concepts. I really don't know if this is similar to the flow rythm stuff you do, but this is where it lead me to.
T
it was what you said in your MLFS book in the last chapter about market flow and rythm that inspired me to develop the non-linear concepts. I really don't know if this is similar to the flow rythm stuff you do, but this is where it lead me to.
T
TO
TonyC
Rep: 99
Posts: 471
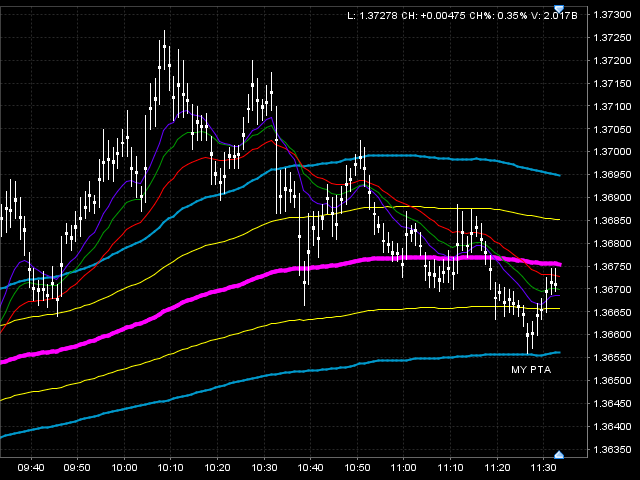
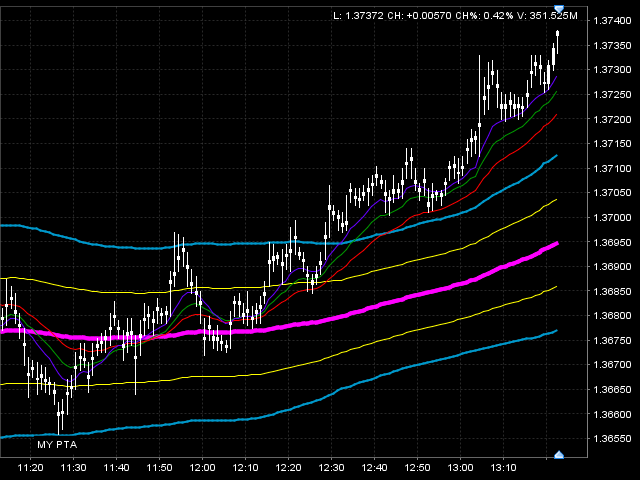
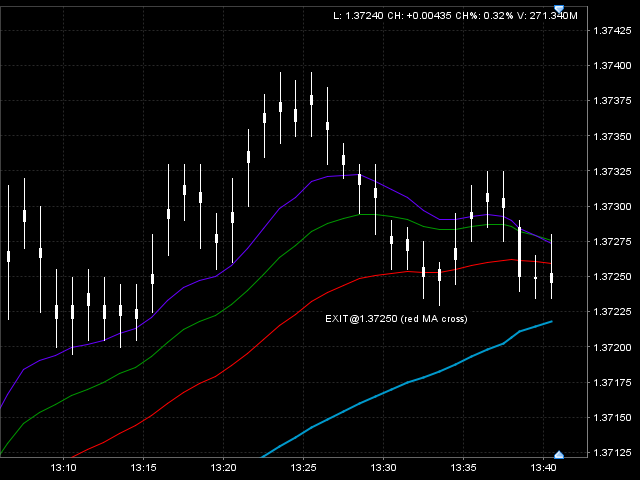
NON-LINEAR EXAMPLE CHARTS
EURUSD 9/13/11 11:25AM TRADE COMING TOGETHER AT MY PTA WITH
SYNERGY SUPPORT FROM LOWER WL, TRADE MANAGEMENT PLAN SET FOR SINGLE TRUST BECAUSE CONTEXT TREND IS DOWN BUT PLAN IS TO RIDE UPFLOW WIHTIN COUNTERTREND, THEREFORE REWARD PROFILE IS SHORT TERM PROFIT GRAB WITH SCALE OUT.
STILL AN ONGOING AS OF TIME TYPING THIS...
t
Click image for original size
Click image for original size
RO
roofer
Rep: 3,689
Posts: 3,574
we are often most critical of that which we fear most in ourselves... note the nature of bruce m. posts today.out of control..not tolerating any differences or questions.joed always said that forums self destruct in such a way... i feel bad for our generous host having to watch this....