ES Thu 8-18-11
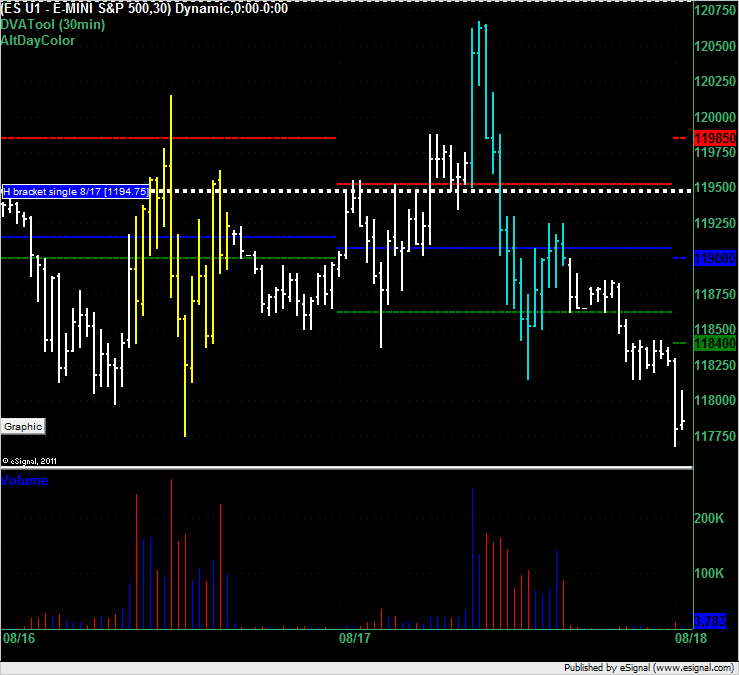
Single print left behind above us a 1194.75 in the H bracket on 8/17 (Wednesday). Coincidence that Wednesday's Market Profile long trade at the market was from the VAH at 1195.25 and now that support price has become a resistance line?
Click image for original size
prestwickdrive if you are around, how do you treat the reaction to the 8:30 news? do you use 168 as the high (high of the swing) or the high of the 8:30 et bar ? thanks !
Originally posted by ayn
prestwickdrive if you are around, how do you treat the reaction to the 8:30 news? do you use 168 as the high (high of the swing) or the high of the 8:30 et bar ? thanks !
Hi Ayn. The reaction off the reports didn't give me a clear signal so I have ignored it. Without a good signal there I am focusing on the reactions off of swing highs and lows. For example, the latest touch of the globex low of 1161 got to 63.75 giving an initial of 1165.5 and a full of 1168.25. If 1161 is touched again those projections fail. Remember that important information is given from failed projections as they are telling us that the market wants to continue in the opposite direction of the failed projection.
thanks for the response, so what are you projecting to the downside if i may ask ? i was using the 68 to 61 swing, which included the 8:30 reaction
I'm using 73 - 75 as the top part of my bell curve today so that is the initial low volume zone. Other key area is 65 as that is peak volume from On so far. If we don't sell off further from these levels then 1159.75 will be the other side of the bell curve.
so any longs will need to watch the 59.75 first..
so any longs will need to watch the 59.75 first..
Originally posted by ayn
thanks for the response, so what are you projecting to the downside if i may ask ? i was using the 68 to 61 swing, which included the 8:30 reaction
That is OK to use but after thinking about it further (I hadn't paid attention to it because i was focusing on crude oil) I am watching that cycle top to low off of the number (1168-1162.25) as there was a nice bounce off of the reaction low. That gave me an initial of 58.75 which hit and a full of 1153.
thanks again prestwick
Originally posted by prestwickdrive
Originally posted by ayn
thanks for the response, so what are you projecting to the downside if i may ask ? i was using the 68 to 61 swing, which included the 8:30 reaction
That is OK to use but after thinking about it further (I hadn't paid attention to it because i was focusing on crude oil) I am watching that cycle top to low off of the number (1168-1162.25) as there was a nice bounce off of the reaction low. That gave me an initial of 58.75 which hit and a full of 1153.
52.50 and 56.75 is low volume from today...getting long into 1150.50
getting long at 36.50.......too far, too soon...48.50 may need to be retested...just too quick to trade and post....sorry
I had numbers at 39.50 and 32.50 so I am and was looking for longs under those for the retests back up...I also had 48.50 but got no long signal for that one before the others traded
trying to hold one last runner for the 48.50 retest...that would be a moonshot for me...concerned that they may jerk it around this 43.75 as that is the end of the one minute air pocket and low volume
Big Mike,
question 1)
The market will not always blow past a low volume node and go to the high volume node . Quite often it just over shoots it and then I get the signal to get short or long. The overshoot runs out the stops from the people who are expecting the market to stop right at the low volume zone. You will see this quite often at single prints for example. Many use fixed stops on that trade and often they get taken out and the market returns to the low volume zone.
question 2) Correct..I used that day because it was below the open of yesterday so I want to know where the key numbers are below and above the open price so I have some references to work from
Emini Day Trading /
Daily Notes /
Forecast /
Economic Events /
Search /
Terms and Conditions /
Disclaimer /
Books /
Online Books /
Site Map /
Contact /
Privacy Policy /
Links /
About /
Day Trading Forum /
Investment Calculators /
Pivot Point Calculator /
Market Profile Generator /
Fibonacci Calculator /
Mailing List /
Advertise Here /
Articles /
Financial Terms /
Brokers /
Software /
Holidays /
Stock Split Calendar /
Mortgage Calculator /
Donate
Copyright © 2004-2023, MyPivots. All rights reserved.
Copyright © 2004-2023, MyPivots. All rights reserved.