ES Thu 8-18-11
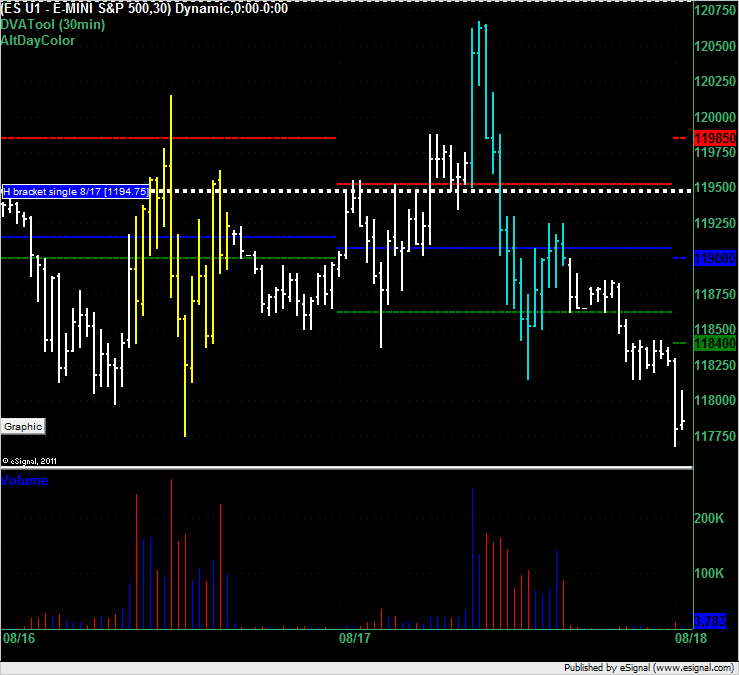
Single print left behind above us a 1194.75 in the H bracket on 8/17 (Wednesday). Coincidence that Wednesday's Market Profile long trade at the market was from the VAH at 1195.25 and now that support price has become a resistance line?
Click image for original size
WTF was that?
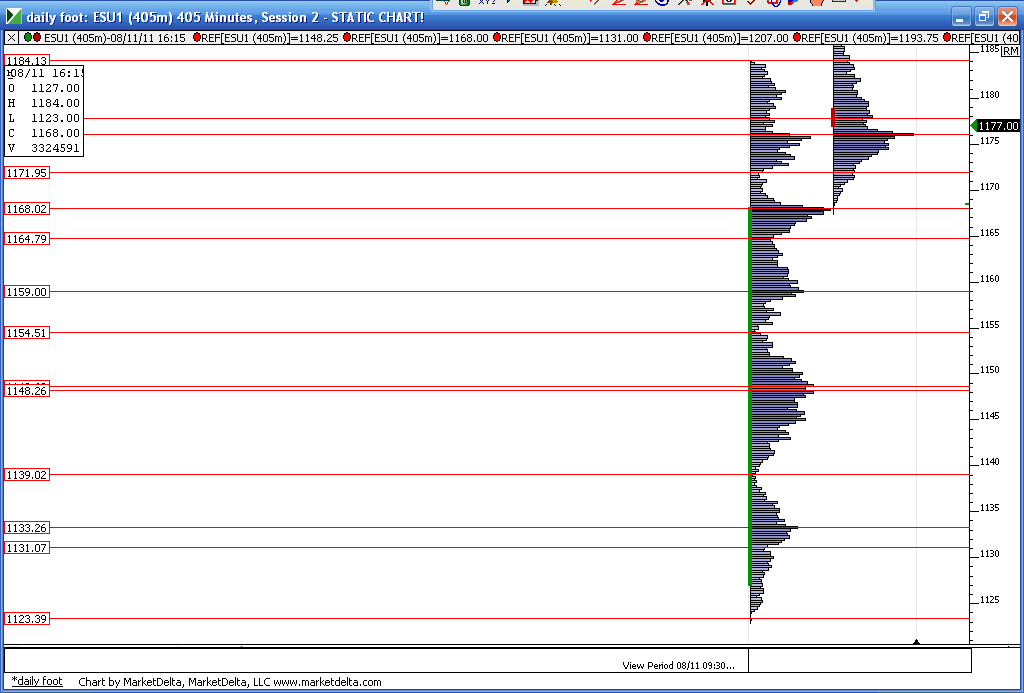
here is a look at that big day on 8-11 and the day following on 8-12 which explains itself as to why I was using the areas I did today. This chart is just marked with the high and low values labeled. Hope it helps some understand the volume and distributions a bit more.
Click image for original size
Thanks Bruce
Thanks bruce
lisa we didnt see the vwap all day
that was a message for me "do not take longs"
I wish I listened
Originally posted by Lisa PYes but having truble putting chart from tradestation in the sight
that was a message for me "do not take longs"
On the other hand, short trades off it would be good...
Click image for original size
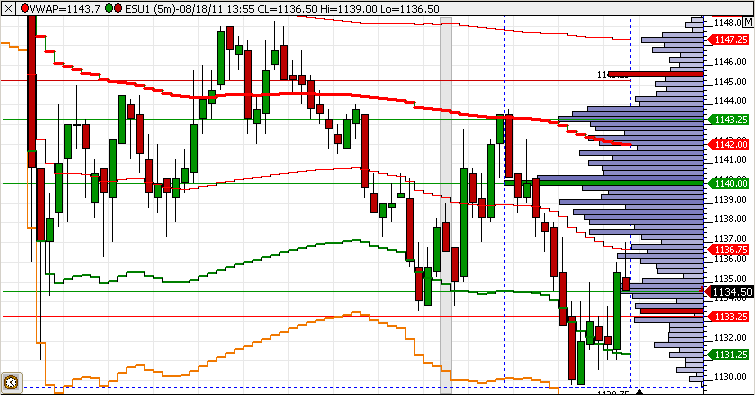
if we got up to the 48.25 i would eat my hat
Big Mike,
question 1)
The market will not always blow past a low volume node and go to the high volume node . Quite often it just over shoots it and then I get the signal to get short or long. The overshoot runs out the stops from the people who are expecting the market to stop right at the low volume zone. You will see this quite often at single prints for example. Many use fixed stops on that trade and often they get taken out and the market returns to the low volume zone.
question 2) Correct..I used that day because it was below the open of yesterday so I want to know where the key numbers are below and above the open price so I have some references to work from
Emini Day Trading /
Daily Notes /
Forecast /
Economic Events /
Search /
Terms and Conditions /
Disclaimer /
Books /
Online Books /
Site Map /
Contact /
Privacy Policy /
Links /
About /
Day Trading Forum /
Investment Calculators /
Pivot Point Calculator /
Market Profile Generator /
Fibonacci Calculator /
Mailing List /
Advertise Here /
Articles /
Financial Terms /
Brokers /
Software /
Holidays /
Stock Split Calendar /
Mortgage Calculator /
Donate
Copyright © 2004-2023, MyPivots. All rights reserved.
Copyright © 2004-2023, MyPivots. All rights reserved.