ES Wed 8-24-11
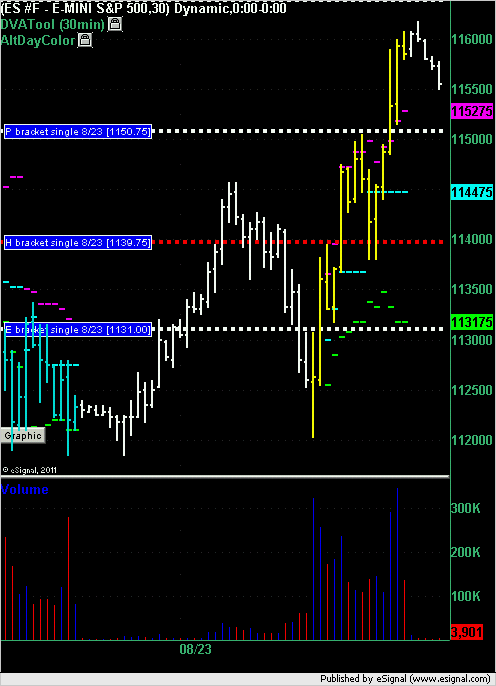
The yellow bars on the chart below are from RTH trading on Tuesday. The white bars on either side are the overnight session bars.
As with most trend days and wide spread days single prints get left behind. The following single prints were generated on Tuesday:
E bracket at 1131.00
H bracket at 1139.75 (filled)
P bracket at 1150.75
After forming the single print in the H bracket the market returned to this price and filled it in triggering a long trade at 1139.75. The draw down was 1.75 points to the subsequent low of 1138.00 and then the best run-up during RTH was 21 points to end of day high of 1160.75.
Did anybody reading this take that single print long?
Click image for original size
numbers I'm using today:
1171
1167.50
1161.50
1149 - 1151.50 ***** key zone I'm looking to get tested in RTH..low volume day session and high volume from Overnight
1144 VA low and O/N low area
1140 - Low volume from day session********
NQ and ES both consolidated in the O/N session in the POC and VA high zone
1171
1167.50
1161.50
1149 - 1151.50 ***** key zone I'm looking to get tested in RTH..low volume day session and high volume from Overnight
1144 VA low and O/N low area
1140 - Low volume from day session********
NQ and ES both consolidated in the O/N session in the POC and VA high zone
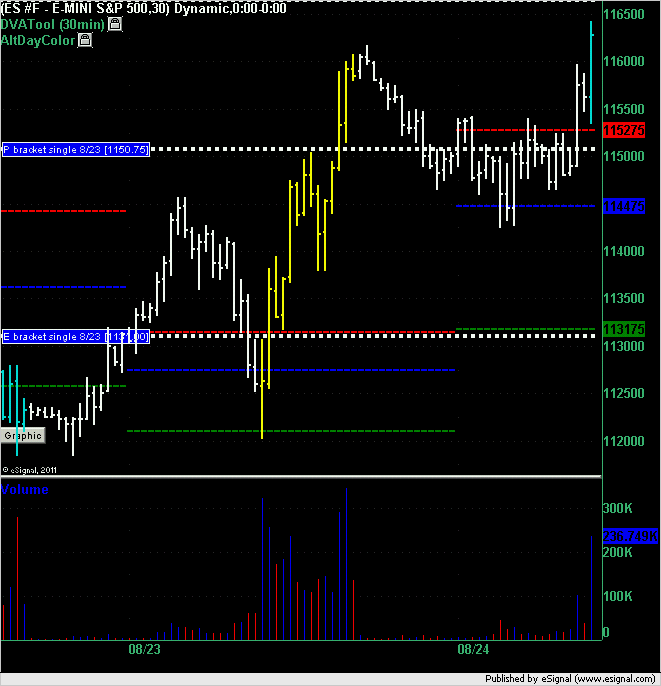
another reason the 1150 is a strong magnet is because it is the second set of single prints from yesterdays trade and the market ran out of time to fill them in during the day session!!!!!
Market opens above value area and above the last single print from yesterday. As Bruce pointed out that 50 area is a strong buy area because of the VAH at 1152.75 and the single print at 1150.75 but with the market already trading up at 1168 I'm not sure if we're going to see those prices again today.
Click image for original size
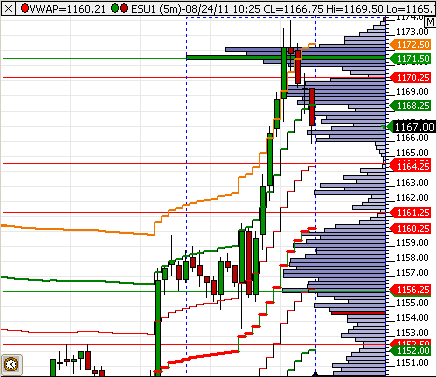
hunting for shorts up in this 72.50 area now !! they may do a blow through for the better short...
pulled most off at 67.50 test...with all that air that was a trade you had to find a way to get short!!
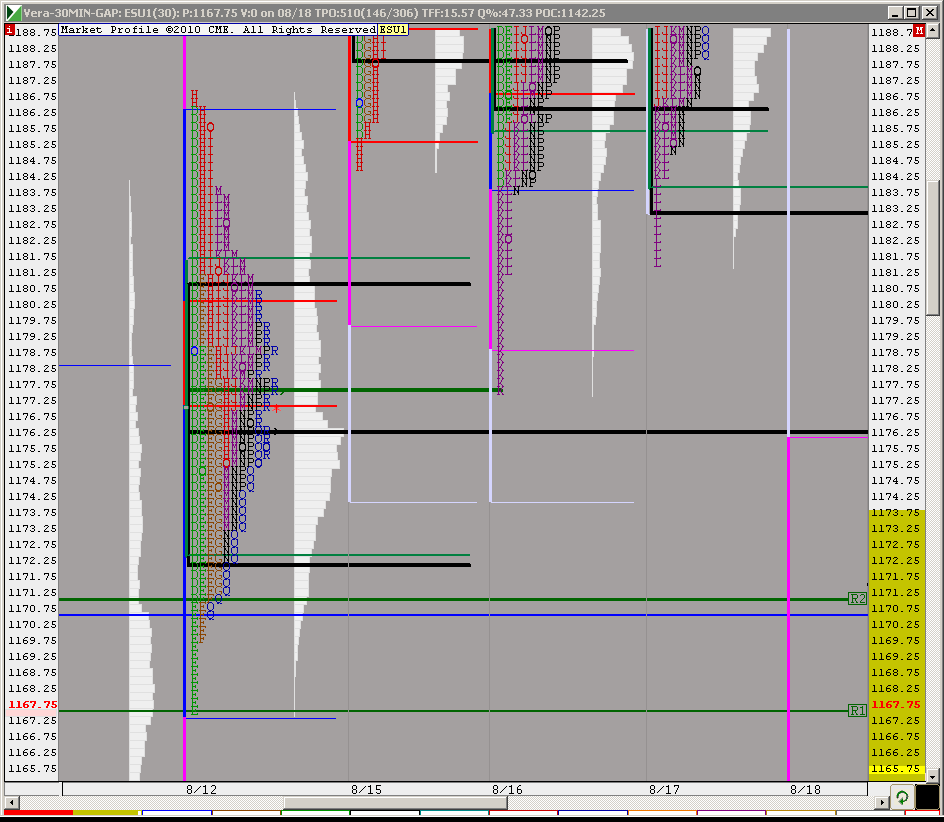
for those interested you should run your single prints from the Overnight on 8 - 18 and see what jumps off the page at you.....there are no real secrest to trading but some areas are better than others.....you will see that great 71 - 73 area...
with a lot of plain dumb luck my final runners will get back into the 62.50 breakout point soon !!
The chart above is RTH only
hi bruce, thanks for the updates
so you did not get a signal to short when blew past the 61.5 area to the 64ish level?
so you did not get a signal to short when blew past the 61.5 area to the 64ish level?
Originally posted by BruceM
pulled most off at 67.50 test...with all that air that was a trade you had to find a way to get short!!
for those interested you should run your single prints from the Overnight on 8 - 18 and see what jumps off the page at you.....there are no real secrest to trading but some areas are better than others.....you will see that great 71 - 73 area...
with a lot of plain dumb luck my final runners will get back into the 62.50 breakout point soon !!
No Nick...I had no signal as per my renko and delta charts until we started getting above the 71 number...it should be noted that I'm hoping most find their own numbers as I type fast and sometimes I transpose my numbers incorrectly....I work off lines I have already marked on my charts....that line up their started at 72.50 and not 71 !!!
so hopefully most are doing their homework!!
so hopefully most are doing their homework!!
my VWAP now is at 1160.75
Emini Day Trading /
Daily Notes /
Forecast /
Economic Events /
Search /
Terms and Conditions /
Disclaimer /
Books /
Online Books /
Site Map /
Contact /
Privacy Policy /
Links /
About /
Day Trading Forum /
Investment Calculators /
Pivot Point Calculator /
Market Profile Generator /
Fibonacci Calculator /
Mailing List /
Advertise Here /
Articles /
Financial Terms /
Brokers /
Software /
Holidays /
Stock Split Calendar /
Mortgage Calculator /
Donate
Copyright © 2004-2023, MyPivots. All rights reserved.
Copyright © 2004-2023, MyPivots. All rights reserved.