ES Thursday 9-29-11
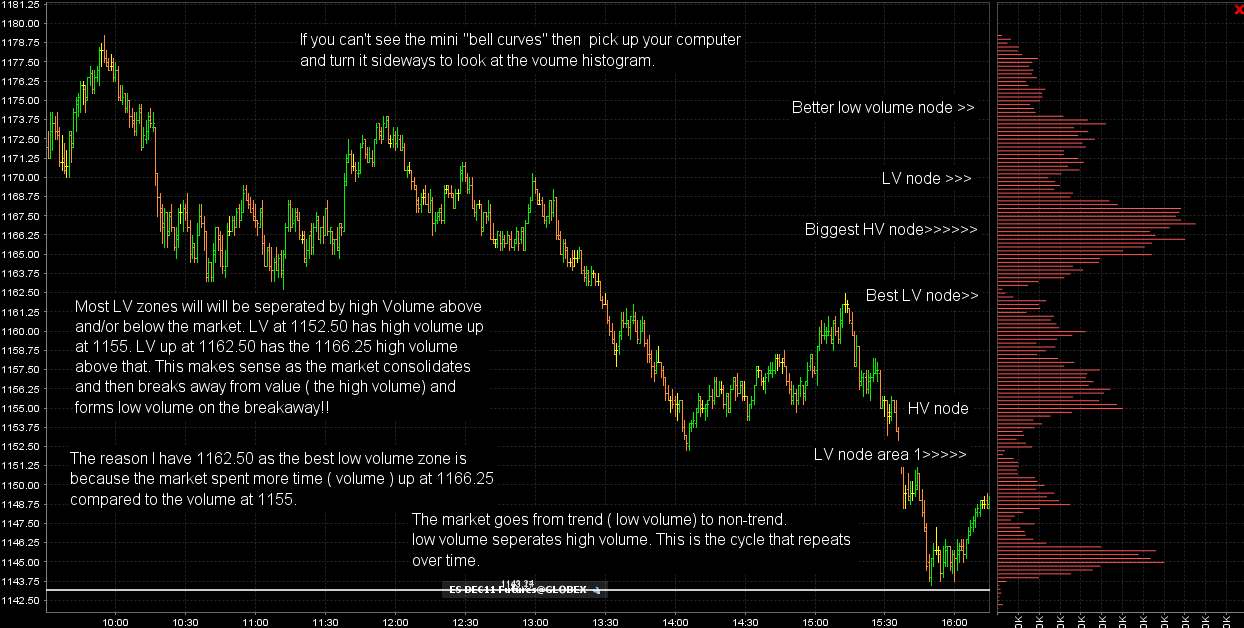
I thought that we could use a refresher and some basics in case we have some new folks here. Most will know this stuff but hopefuly this will inspire some questions or help clear up any questions regarding the use of high and low volume in your analysis. Here is todays chart with the key areas labelled for Thursdays trade.
Click image for original size
I will echo Monkey's sentiment - what a great day at the Forum. A wealth of information today. Just outstanding. Thanks to Bruce, Lorn, DT, Lisa P and all the rest who believe in the value of sharing what they have learned.
Continued success!
Continued success!
Agree, Thank you ALL, VERY helpful & a great day of profits, gonna go give a little time back to community, Cheers
u got it della...u don't need me...LOL..I don't like trades at the high volume but the buys off the 37.50 worked well for some....I'm sitting back with a Johnny walker red and water...
Originally posted by della
bruce you think move back to 42.50 LV area??
agree with all the great comments...we all rocked the house today...thanks to all who came to just view today and those who viewed and posted today
I still need you im only in 4th grade maybe
Originally posted by BruceM
u got it della...u don't need me...LOL..I don't like trades at the high volume but the buys off the 37.50 worked well for some....I'm sitting back with a Johnny walker red and water...Originally posted by della
bruce you think move back to 42.50 LV area??
I would like to concur with previous comments on the value of the commentary today especially to a greenhorn like me.
Bruce what is the software you are displaying above?
Cheers
Bruce what is the software you are displaying above?
Cheers
It's just the very basic and free charts from interactive brokers...
Ok thanks I will take a look.
Originally posted by sandoxe
Yes BM I will post a chart latter saying why.
Stop out B.E. 1147.75 @ 13:57 Will try again latter.
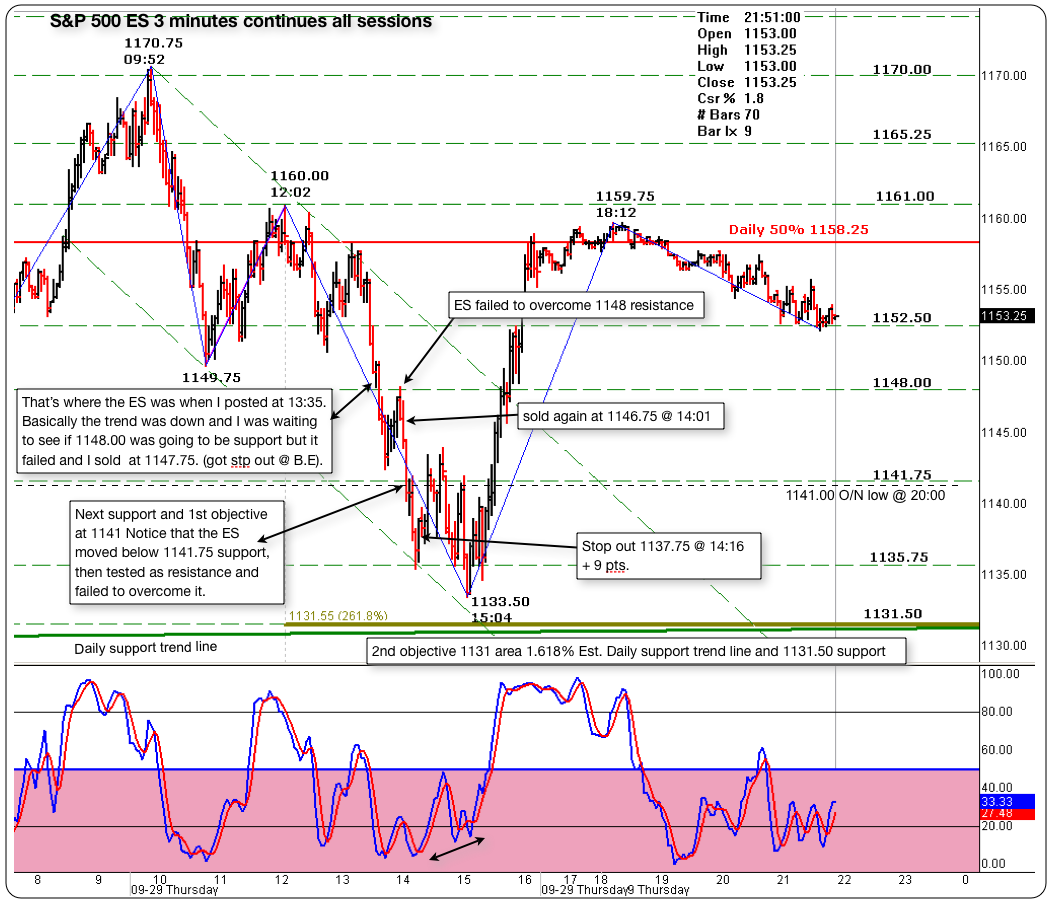
Here's a 3 minute chart with all the details and reasons for the posted trade.
Basically the trade started "anywhere within the trend" the trend was down and I like easy money. That was a momo play from S/R at 1148.00. Granted, it took me two shots to get it right, but, that's what happens some times and if you believe in what you see, heck give it a shot! Keep that stop near by.
I hope this helps in some way.
Click image for original size
To BruceM and Lorn I want to thank you both for your informed answers Since I was not trading most of the day on September 29, 2011 I had to read your answers without having the benefit of looking at charts to compare it to
what I understand from reading the thread is if the price is BELLOW the LOW VOLUME NODE than it will act as a supply zone and I have to short the market and get out at the High Volume area and vice versa for a Long. if this is correct than I’m Ok with your explanation otherwise will it be possible for you just to hand draw a chart with arrows to show high low volume Nodes the current open price and what we anticipate to do when the price hit the low volume and or high volume I assume it is like a kindergarten for you but for me it is the best trading university I have had
Second question is about BRUCEM statement of “having the correct volume data” Since I have Trade Station as my data feed and as you know they filter their tick data (6 out of 10) will I be able to use their volume data to properly trade the volume nodes?
Trading strategy and setups are briefly given on the platform visit and get more useful information about any type of trading
Emini Day Trading /
Daily Notes /
Forecast /
Economic Events /
Search /
Terms and Conditions /
Disclaimer /
Books /
Online Books /
Site Map /
Contact /
Privacy Policy /
Links /
About /
Day Trading Forum /
Investment Calculators /
Pivot Point Calculator /
Market Profile Generator /
Fibonacci Calculator /
Mailing List /
Advertise Here /
Articles /
Financial Terms /
Brokers /
Software /
Holidays /
Stock Split Calendar /
Mortgage Calculator /
Donate
Copyright © 2004-2023, MyPivots. All rights reserved.
Copyright © 2004-2023, MyPivots. All rights reserved.