ES Monday 10-10-11
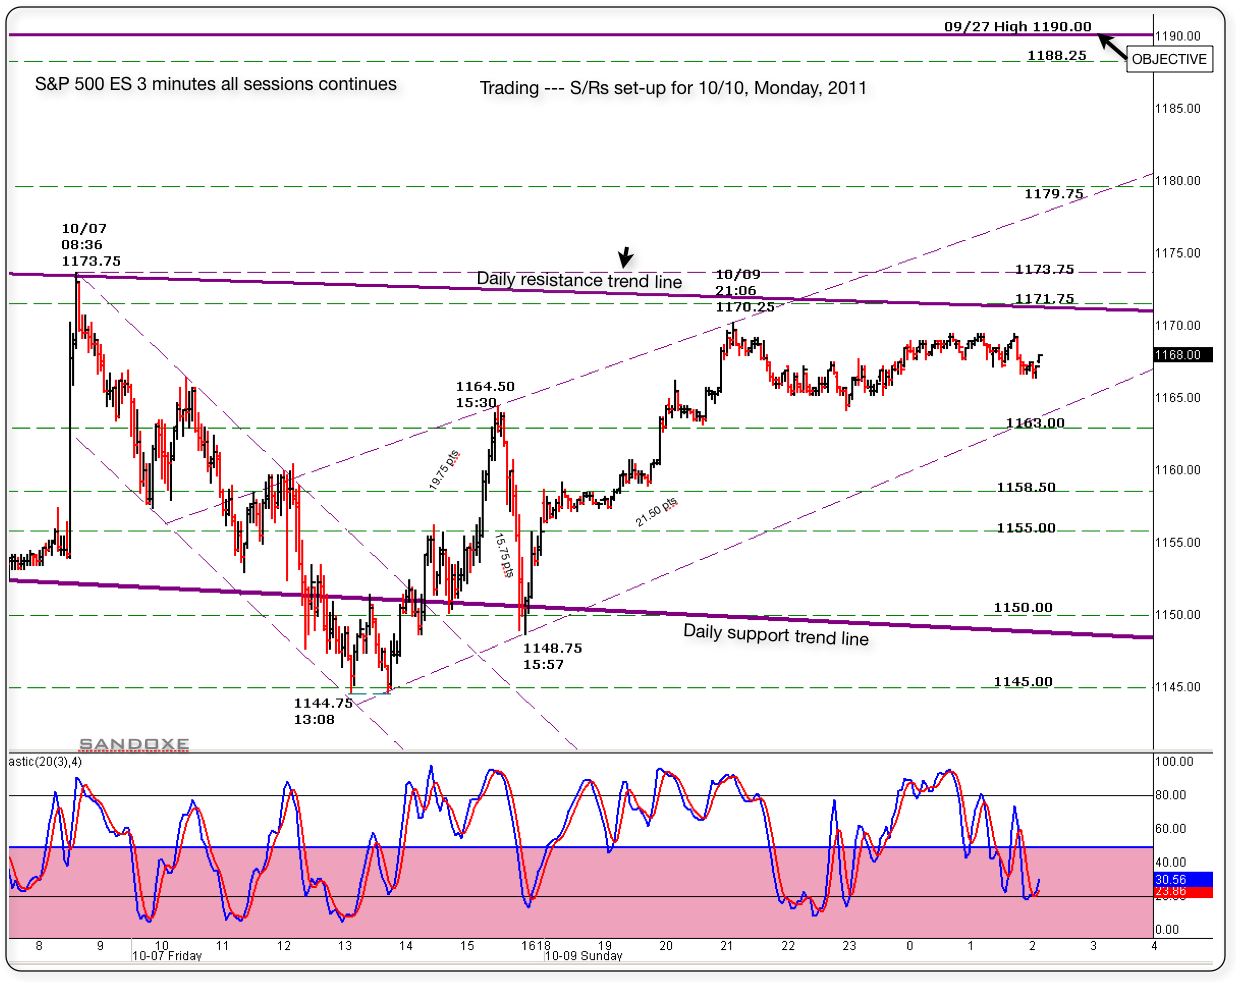
Here is the same Friday's 3 minute chart following up for Monday's S/Rs play.
Reviewing the daily chart I found one more resistance line that will be crossing around 1170/1168 on Monday, as seeing in the chart.
Moving above that trend line and testing as support will target the 1190.00 Objective.
I like to borrow some posts from Friday bc the same S/Rs are applicable for Tomorrow's session. (1163/1157/1145/43 and 1129)
____________________________________
sandoxe | 7-Oct-2011 at 9:25 AM
It's important for the ES to close over 1163.00 in a daily basis. if so, next objective is 1190.00. 1190.00 is 09/27 high.
1163 was the S/R objective for yesterday. Now becomes the S/R base to play the out side. Below 1163.00 is 1157.00 also important
to keep in mind.
____________________________________
sandoxe | 7-Oct-2011 at 12:35 PM
Wow. This market is gonna have to work very hard to get out of the negative fractal created today. Lots of zig-zags of 20 or more points to get out of it.
The other way, will be to go down to 1143.00 or 1129.00, gather some momo and back up to break 1170.00, few days in this area.
If 1129 does not hold? --Back to test 1068.00....
JMO.-.-..
____________________________________
The above post mentioned that the market could be making 20 points (+-) swings moving to break 1170.00. -( Actually Friday's high 1173.75).
Notice that in the chart, the ES has made some good moves, close to 20 pts since that post. I hope it maintains that volatility, I love it!
As always, the market has the last word and in due time will show us the way.
I see for you the same I se for my self: Having the best of luck and fun, awesome profitable trading day!
Click image for original size
On page (1) you gave that 87 number for possible entry
also 96.75 for tomorrow (TPO) number noy VOL I do not have vol for that and then 1200.25
also 96.75 for tomorrow (TPO) number noy VOL I do not have vol for that and then 1200.25
Originally posted by Lisa P
First significant volume today
Click image for original size
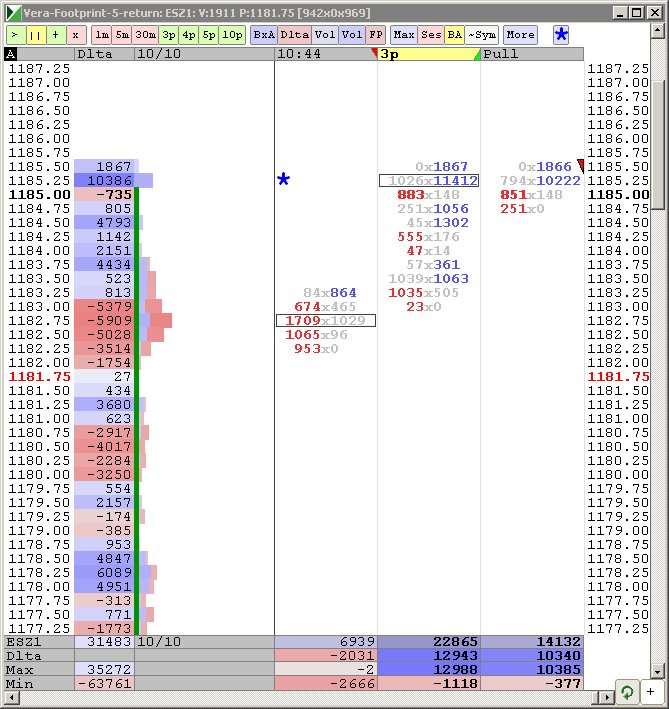
Did you view this a divergence? Huge volume of buyers but no upward push. So short looking for 79 or...?
TIA
Mike
use past days for your entries based on low volume areas...yes...that is always true.....
now if you find an entry for ANY ( no matter what method u use) reason then I would always use a low volume area as a target that has developed in the current day as we can never be sure what will happen at developing low volume...all we really know is that developing low volume likes to get tested
now if you find an entry for ANY ( no matter what method u use) reason then I would always use a low volume area as a target that has developed in the current day as we can never be sure what will happen at developing low volume...all we really know is that developing low volume likes to get tested
Originally posted by della
Bruce are you saying enter from past days exit on today as target if its given??
86 - 88 is first support low volume zone for Overnight...if u dare
Below you will find the "after the fact" chart showing today's price action with the Fibonacci extensions.
Notice how the price reacts to the levels as it moves up, towards the 1190.00 objective, that eventually is hit before market close.
Below the "after the fact chart" you will see the "before the fact chart" posted at 03;15 this morning with some comments, pointing out, that if the ES was to move above the daily resistance trend line will target 1190.00. ( Lucky me it did, Many times it doesn't do what I anticipate it will do.)
The ES actually open gap up and never look back. The tick was above the "0" line most of the morning as Lorn pointed out in one of the posts. Good up trending for the first hour or so.
It was a fun day in did. I'm learning a lot my self.-.-.-.-.
Click image for original size

Originally posted by sandoxe
Here is the same Friday's 3 minute chart following up for Monday's S/Rs play.
Reviewing the daily chart I found one more resistance line that will be crossing around 1170/1168 on Monday, as seeing in the chart.
Moving above that trend line and testing as support will target the 1190.00 Objective.
I like to borrow some posts from Friday bc the same S/Rs are applicable for Tomorrow's session. (1163/1157/1145/43 and 1129)
____________________________________
sandoxe | 7-Oct-2011 at 9:25 AM
It's important for the ES to close over 1163.00 in a daily basis. if so, next objective is 1190.00. 1190.00 is 09/27 high.
1163 was the S/R objective for yesterday. Now becomes the S/R base to play the out side. Below 1163.00 is 1157.00 also important
to keep in mind.
____________________________________
sandoxe | 7-Oct-2011 at 12:35 PM
Wow. This market is gonna have to work very hard to get out of the negative fractal created today. Lots of zig-zags of 20 or more points to get out of it.
The other way, will be to go down to 1143.00 or 1129.00, gather some momo and back up to break 1170.00, few days in this area.
If 1129 does not hold? --Back to test 1068.00....
JMO.-.-..
____________________________________
The above post mentioned that the market could be making 20 points (+-) swings moving to break 1170.00. -( Actually Friday's high 1173.75).
Notice that in the chart, the ES has made some good moves, close to 20 pts since that post. I hope it maintains that volatility, I love it!
As always, the market has the last word and in due time will show us the way.
I see for you the same I se for my self: Having the best of luck and fun, awesome profitable trading day!
Click image for original size
Originally posted by BruceM
...In my book "secret recipes" are not tolerated well and that is a huge turnoff.....for anyone reading , please keep your secret formulas - secret....if we need secrets we'll go to paltalk and all the other paper traders....
Good way of putting in BruceM and I agree with that. If you have a secret formula or trading method then keep it a secret. I hope that you are profitable using it and wish you good fortune with it. But please, as BruceM said, don't talk about it here because it doesn't help anyone.
Ditto here. I've seriously tried to understand and distill down what/why/how with your postings over time ... when you were active in the past and also currently. I'm at a loss - even now. It's primarily just numbers posted without any conveyed, understandable rationale for actual learning or trading as a day (or days) unfold.
More significantly, it's so much "if then," where the IF and THEN are not described in a way that fills the space between the prognostications ... and when price does (and also DOESN'T) reach one of the multiple levels posted. In a word, it's "confusing."
More significantly, it's so much "if then," where the IF and THEN are not described in a way that fills the space between the prognostications ... and when price does (and also DOESN'T) reach one of the multiple levels posted. In a word, it's "confusing."
Emini Day Trading /
Daily Notes /
Forecast /
Economic Events /
Search /
Terms and Conditions /
Disclaimer /
Books /
Online Books /
Site Map /
Contact /
Privacy Policy /
Links /
About /
Day Trading Forum /
Investment Calculators /
Pivot Point Calculator /
Market Profile Generator /
Fibonacci Calculator /
Mailing List /
Advertise Here /
Articles /
Financial Terms /
Brokers /
Software /
Holidays /
Stock Split Calendar /
Mortgage Calculator /
Donate
Copyright © 2004-2023, MyPivots. All rights reserved.
Copyright © 2004-2023, MyPivots. All rights reserved.