ES Monday 10-10-11
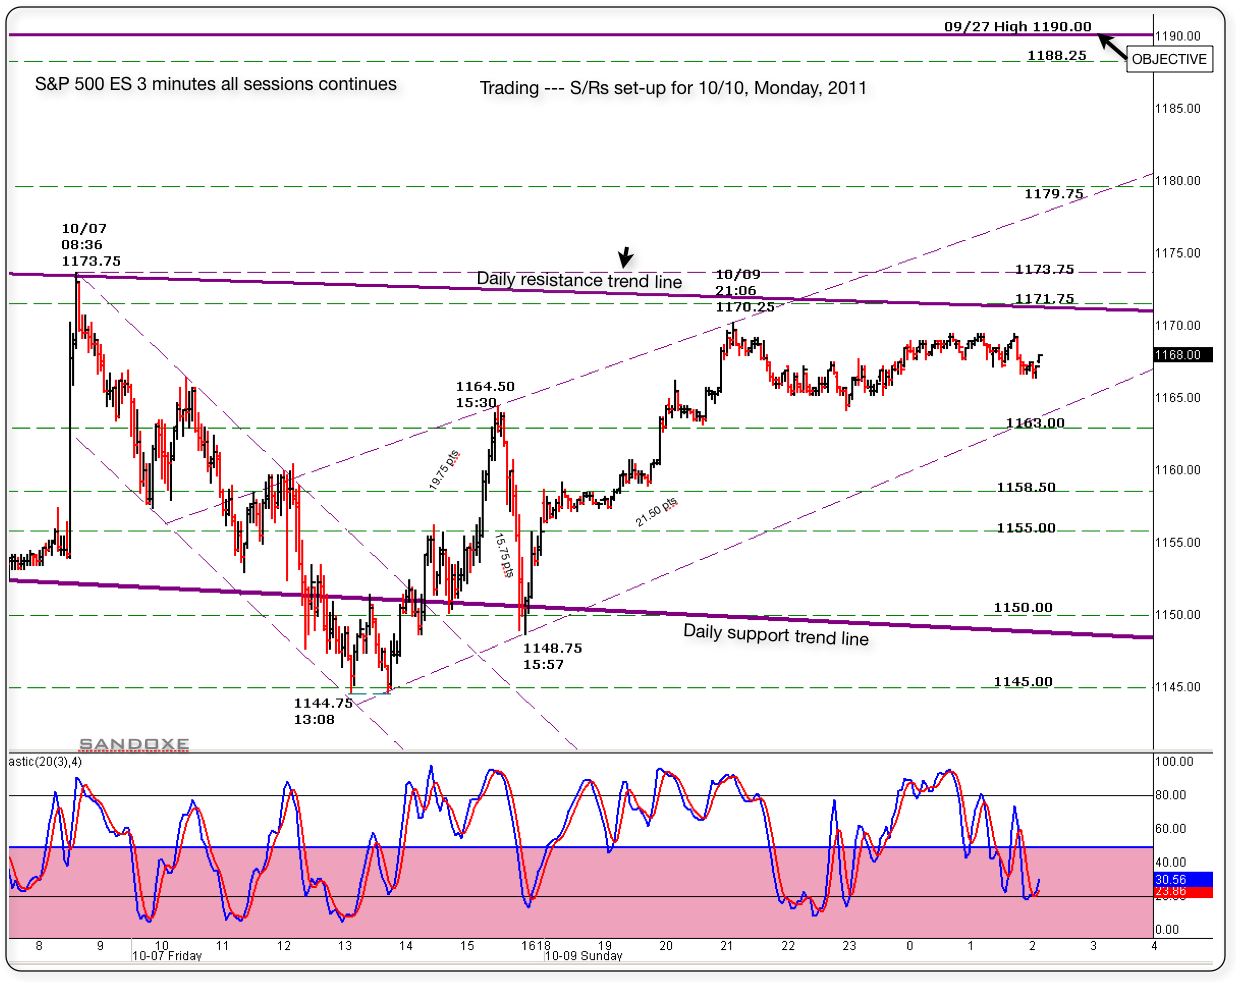
Here is the same Friday's 3 minute chart following up for Monday's S/Rs play.
Reviewing the daily chart I found one more resistance line that will be crossing around 1170/1168 on Monday, as seeing in the chart.
Moving above that trend line and testing as support will target the 1190.00 Objective.
I like to borrow some posts from Friday bc the same S/Rs are applicable for Tomorrow's session. (1163/1157/1145/43 and 1129)
____________________________________
sandoxe | 7-Oct-2011 at 9:25 AM
It's important for the ES to close over 1163.00 in a daily basis. if so, next objective is 1190.00. 1190.00 is 09/27 high.
1163 was the S/R objective for yesterday. Now becomes the S/R base to play the out side. Below 1163.00 is 1157.00 also important
to keep in mind.
____________________________________
sandoxe | 7-Oct-2011 at 12:35 PM
Wow. This market is gonna have to work very hard to get out of the negative fractal created today. Lots of zig-zags of 20 or more points to get out of it.
The other way, will be to go down to 1143.00 or 1129.00, gather some momo and back up to break 1170.00, few days in this area.
If 1129 does not hold? --Back to test 1068.00....
JMO.-.-..
____________________________________
The above post mentioned that the market could be making 20 points (+-) swings moving to break 1170.00. -( Actually Friday's high 1173.75).
Notice that in the chart, the ES has made some good moves, close to 20 pts since that post. I hope it maintains that volatility, I love it!
As always, the market has the last word and in due time will show us the way.
I see for you the same I se for my self: Having the best of luck and fun, awesome profitable trading day!
Click image for original size
on 83.75.....lets see if they can test our 79 - 80 zone....we know two things up here...the hour is closing and we are getting close to the 87.50 area!! ok three things...we just may get those single prints to confirm
this is usually a high probability retest when we get low volume from today forming at a low volume area from a previous day.
Originally posted by della
Any foot print up here ??
Della, no significant footprints today, but here is "the other side" date 9/27
Click image for original size
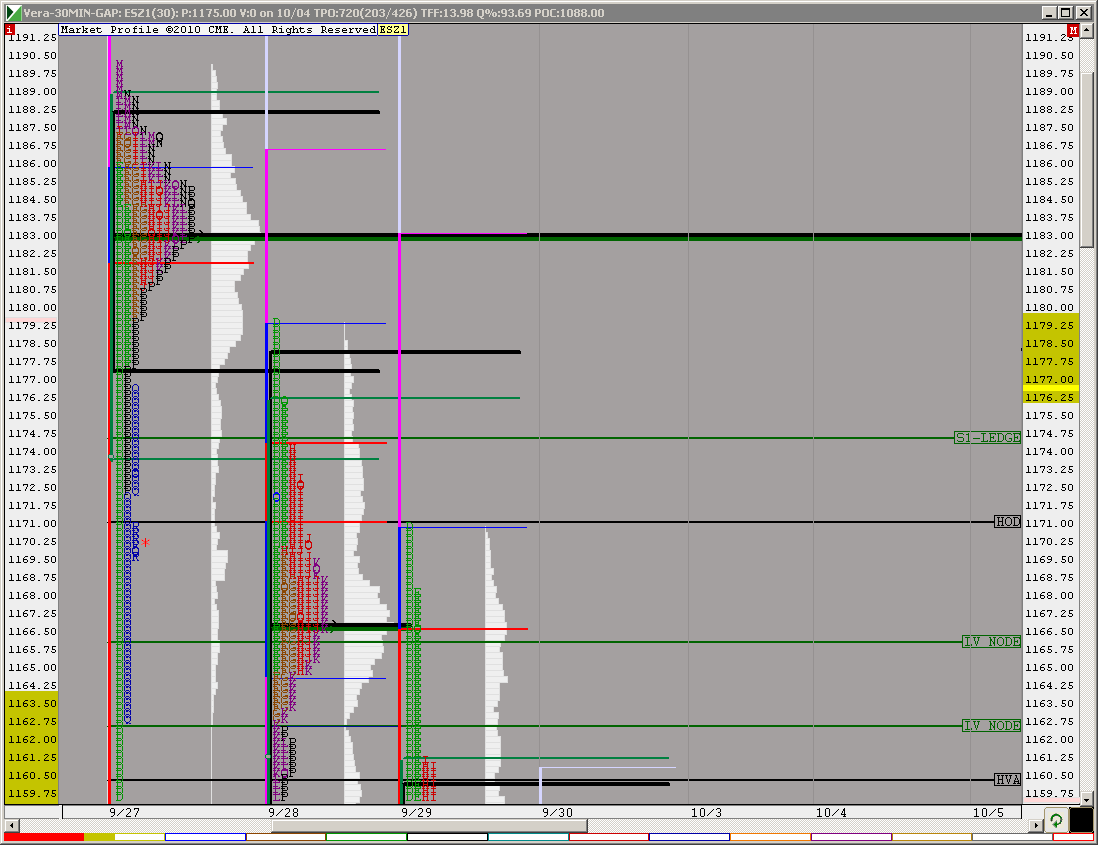
Nice observation Lorn. up trend day. That 1184. and 1188 have few Fib. ext. hitting it. Most likely a pause for coffee.--
Originally posted by Lorn
Until TICK can print below zero shorts are iffy business. That 1190 zone is looking interesting.
any push above the hour hours now attempts to make the second set of single prints on the day..some know how I feel about those...so I'm still picking at the short side...
the big surprise will be if we DON"T get thet 79 - 80 retest and soon....usually they will test back to see if they will hold inside the lower edge of the bell curve...see Lisa's beautiful chart and scroll left to see the lower edge..
the big surprise will be if we DON"T get thet 79 - 80 retest and soon....usually they will test back to see if they will hold inside the lower edge of the bell curve...see Lisa's beautiful chart and scroll left to see the lower edge..
3 tris for me sofar
First significant volume today
Click image for original size
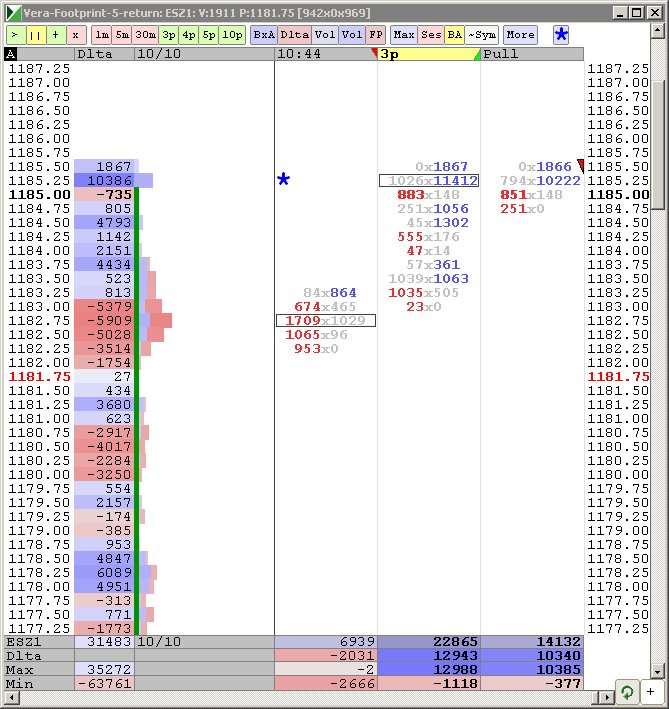
there they are little bugers
LV 81.50 and 79.75
we know they want to test a bracket ( 30 minute ) low...hopefully this will be it
Ditto here. I've seriously tried to understand and distill down what/why/how with your postings over time ... when you were active in the past and also currently. I'm at a loss - even now. It's primarily just numbers posted without any conveyed, understandable rationale for actual learning or trading as a day (or days) unfold.
More significantly, it's so much "if then," where the IF and THEN are not described in a way that fills the space between the prognostications ... and when price does (and also DOESN'T) reach one of the multiple levels posted. In a word, it's "confusing."
More significantly, it's so much "if then," where the IF and THEN are not described in a way that fills the space between the prognostications ... and when price does (and also DOESN'T) reach one of the multiple levels posted. In a word, it's "confusing."
Emini Day Trading /
Daily Notes /
Forecast /
Economic Events /
Search /
Terms and Conditions /
Disclaimer /
Books /
Online Books /
Site Map /
Contact /
Privacy Policy /
Links /
About /
Day Trading Forum /
Investment Calculators /
Pivot Point Calculator /
Market Profile Generator /
Fibonacci Calculator /
Mailing List /
Advertise Here /
Articles /
Financial Terms /
Brokers /
Software /
Holidays /
Stock Split Calendar /
Mortgage Calculator /
Donate
Copyright © 2004-2023, MyPivots. All rights reserved.
Copyright © 2004-2023, MyPivots. All rights reserved.