ES Wednesday 10-12-11
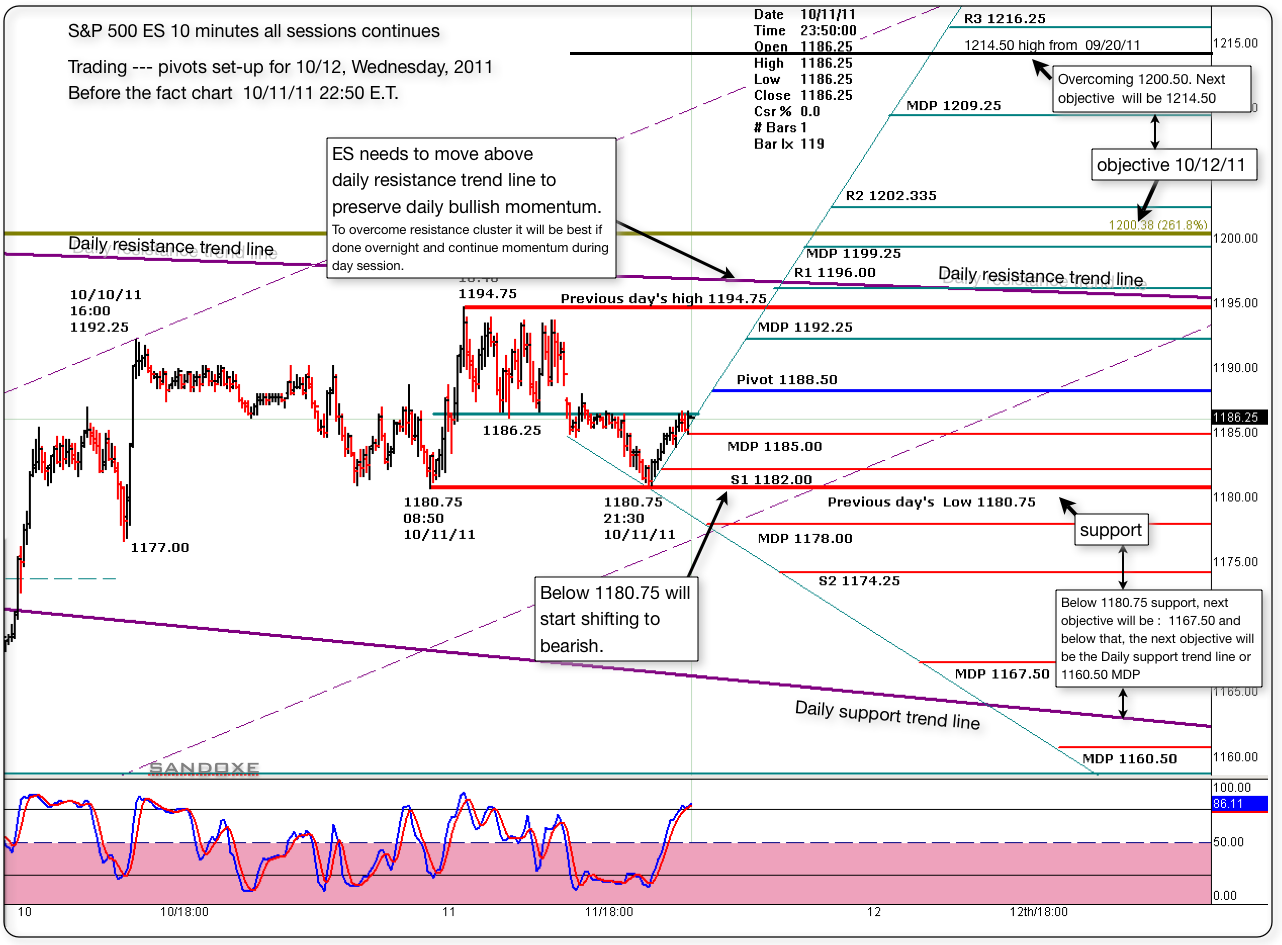
Below you will see a 10 minutes all sessions "before the fact chart" with the pivots set-up for today's session. The chart is self explanatory.
Will see what the market has for us, and as always, the market has the last word and in due time will show us the way.
I see for you the same I see for my self: Having the best of luck and fun, awesome profitable trading day!
Will see what the market has for us, and as always, the market has the last word and in due time will show us the way.
I see for you the same I see for my self: Having the best of luck and fun, awesome profitable trading day!
Click image for original size
Hey Sandoxe. Curious to know how the "Daily support trend line" and "Daily resistance trend line" are derived or drawn??? I too am an S/R trader and have found some of the most incredible trades are ones where MP strategies (i.e. VAH, VAL, POC, LVN, etc.) line up within a point or less of my own targets. I would add to anyone checking out this site and/or Market Profile to really pay attention and take the time to learn this art form (Market Profile). It truly is the fabric of how the market moves. There are incredible traders in this room that are gracious enough to share their insight; namely Bruce, DT, Lisa, and others. So thanks to them and thanks in advance Sandoxe for your posts as it gives others alternate views to how others approach this market.
YW. Capitalista.
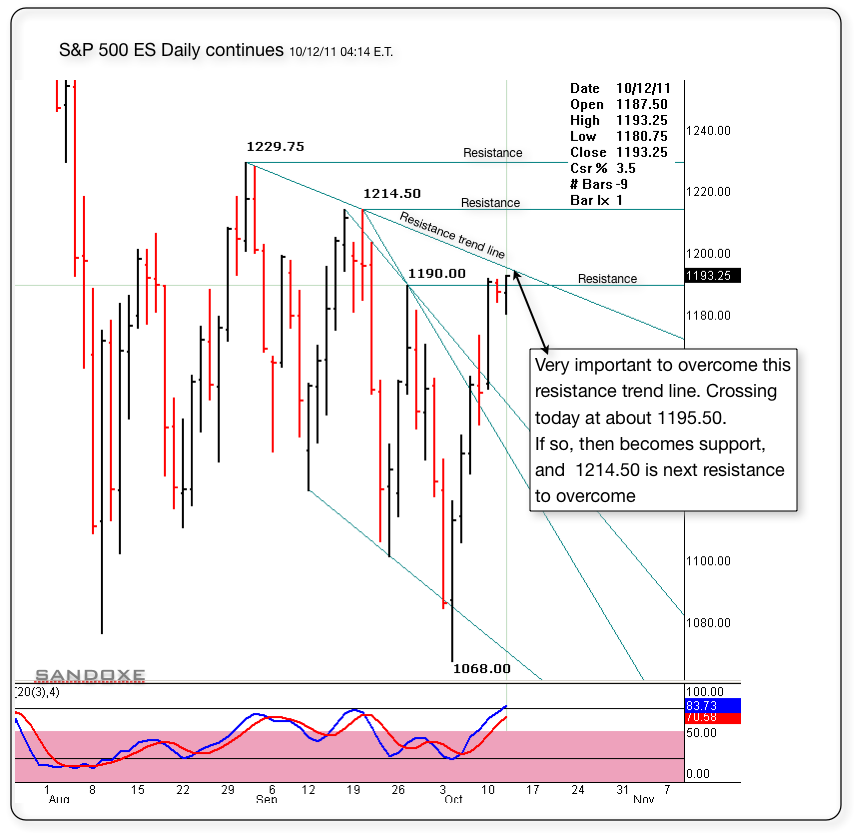
Below is the ES daily chart with basic drawn S/Rs I just switch from daily to intraday charts and the trend lines will be there. Some times I need to go back and adjust them a bit.
Notice that in the chart, the ES is about to test the resistance trend line. But as I'm typing the ES is already testing it and trading at 1197.50 @ 04:44 E.T.
Originally posted by Capitalista
Hey Sandoxe. Curious to know how the "Daily support trend line" and "Daily resistance trend line" are derived or drawn??? I too am an S/R trader and have found some of the most incredible trades are ones where MP strategies (i.e. VAH, VAL, POC, LVN, etc.) line up within a point or less of my own targets. I would add to anyone checking out this site and/or Market Profile to really pay attention and take the time to learn this art form (Market Profile). It truly is the fabric of how the market moves. There are incredible traders in this room that are gracious enough to share their insight; namely Bruce, DT, Lisa, and others. So thanks to them and thanks in advance Sandoxe for your posts as it gives others alternate views to how others approach this market.
Click image for original size
can somebody check my numbers as we go back
1200.25 first one then 1203.25 second one 1205.50 third one on
top 1194.50 1186.25 1185.50 1183.75 bottom
bruce check them out please
1200.25 first one then 1203.25 second one 1205.50 third one on
top 1194.50 1186.25 1185.50 1183.75 bottom
bruce check them out please
Richard ..i'm in a rush but the most important numbers will be the 1204 - 1206 as resistance then below is 94 - 96.50...then u can use all of yesterdays RTH numbers...so if we gap up in RTH then the 94 - 96.50 will be potential support as that is also part of yesterdays upper edge bell curve...then 91.50 is high volume then the 86 etc.....that is lower edge of the bell
don't have too many numbers...you want to trade from only the best ones...be patient and wait for them to hit...I would avoid the 1200
you then determine which ones to use depending on where we open in the day session....so if we open at 98 for example then you look at that 94 - 96 as an area to POTENTIALLY get long if it drops there...
if we open and then run up above the current Overnight high of 1203.75, then you will look to sell into the 1204 - 1206....best to get out of your trades slightly in front of the high volume nodes..
I see "the last set of singles" on 9/20 - 1202.25 up to 1208.75 on my charts. Anyone to confirm?
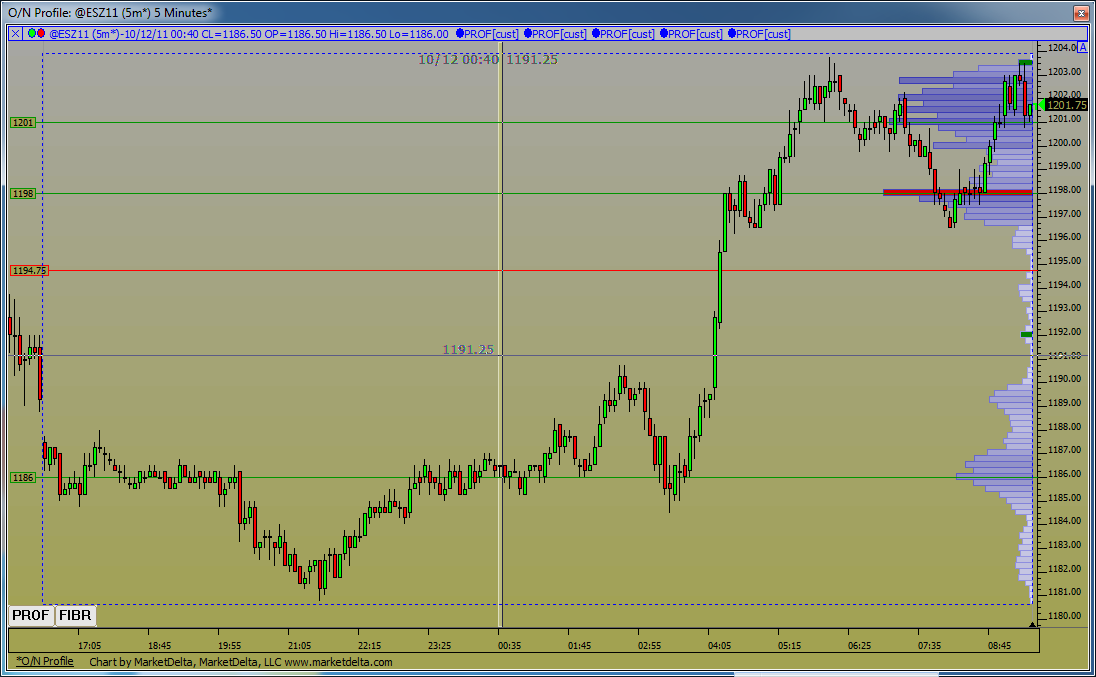
O/N Profile. Showing support of zones from yesterday that Bruce mentioned.
Click image for original size
Sorry Lisa but I don't confirm any singles in that range.
Originally posted by Lisa P
I see "the last set of singles" on 9/20 - 1202.25 up to 1208.75 on my charts. Anyone to confirm?
Lorn, is the histogram on your chart for ON, or yesterday's RTH?
I only use RTH for MP analysis so that might be the difference.
Oh, the chart I posted is the current O/N volume histogram.
Oh, the chart I posted is the current O/N volume histogram.
Originally posted by Lisa P
Lorn, is the histogram on your chart for ON, or yesterday's RTH?
LV from over night 94.25 to 95.50
Something very important I left out:
In the "after the fact chart", notice how the E.W. (Elliot wave) unfolds right with the pivots. Some times the pivots are amazing!!
In the "after the fact chart", notice how the E.W. (Elliot wave) unfolds right with the pivots. Some times the pivots are amazing!!
Originally posted by sandoxe
Below is the follow up chart for the "before the fact chart" posted this morning at 01:25. THe chart is self explanatory.
Click image for original size
Originally posted by sandoxe
Below you will see a 10 minutes all sessions "before the fact chart" with the pivots set-up for today's session. The chart is self explanatory.
Will see what the market has for us, and as always, the market has the last word and in due time will show us the way.
I see for you the same I see for my self: Having the best of luck and fun, awesome profitable trading day!
Click image for original size

Emini Day Trading /
Daily Notes /
Forecast /
Economic Events /
Search /
Terms and Conditions /
Disclaimer /
Books /
Online Books /
Site Map /
Contact /
Privacy Policy /
Links /
About /
Day Trading Forum /
Investment Calculators /
Pivot Point Calculator /
Market Profile Generator /
Fibonacci Calculator /
Mailing List /
Advertise Here /
Articles /
Financial Terms /
Brokers /
Software /
Holidays /
Stock Split Calendar /
Mortgage Calculator /
Donate
Copyright © 2004-2023, MyPivots. All rights reserved.
Copyright © 2004-2023, MyPivots. All rights reserved.