ES Friday 10-28-2011
Yesterday's profile with a fib projection pointing down. I'll add that projections down from the O/N high and the secondary high at 1282.25 both have zones in the 1272.50 area which is lining up nicely with that important LVN at that level.
Click image for original size
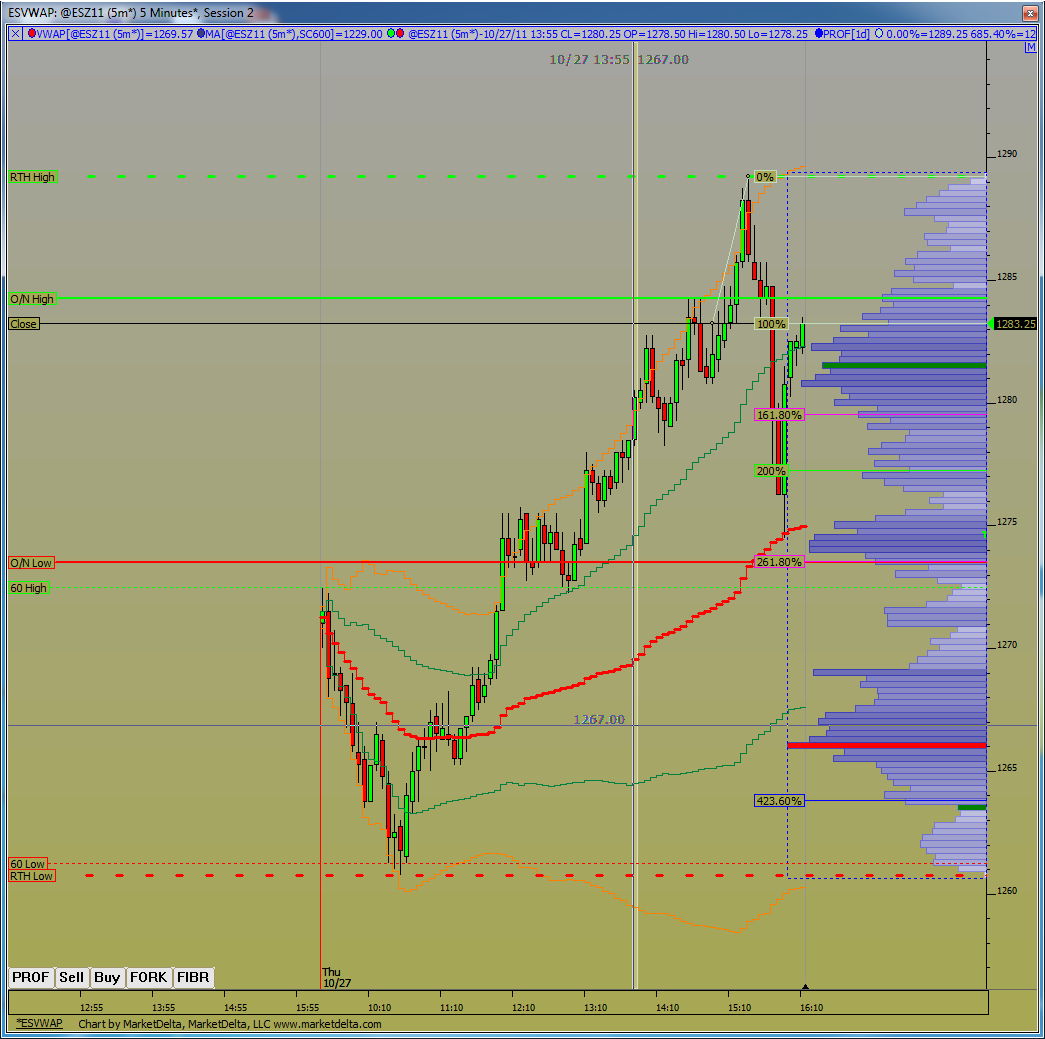
the ideal setup for a long trade willbe if they run that double low and form air pockets into the air pockets from yesterday...
we'll call that "air on air" price action!! for fun!!..74 still beingthe magnet to keep in mind
we'll call that "air on air" price action!! for fun!!..74 still beingthe magnet to keep in mind
nice initial chart post above Bruce showing the larger low vol area, nice for initial range...
Sometimes the best thing about market structure is just knowing when not to trade....I'm waiting and haven't traded yet..I missed the buy point under the O/N lows...seems like we will need to work off the hour range today.....
My IB data messed me up...there is no double low...damn!!
My IB data messed me up...there is no double low...damn!!
Originally posted by Lorn
Absolutely Bruce. One must learn to know when to adjust holding targets. Its still early in the day, things will develop as the day marches onward.
Originally posted by BruceM
we opened inside YD range and multiple trades through the open...not the day to be trying to hold for big trends...especially after yesterdays trend in the afternoon....fading strategies should do well
thanks Chris..it seems that if they consolidate today then that is the most logical area to do it...I must admit that the 74 volume buldge messed up my volume areas to work from today....
nice initial chart post above Bruce showing the larger low vol area, nice for initial range...
on the 80.25 for 78.75 retest..need better air so this is agressive and lite up here
78.75 is still LV from today and part of bigger LV zone...tricky though...great entry and so far no exit for me
need this hour breakout to fail and have them go back for the 74.50 volume....two left..trying for 76.50 and then 74.50..gonna be hard especially with those who want that gap fill
my 76.50 target is right at the midpoint.....may be too obvious...flat at 78.75...will try again
Manipulation can reach an end point where nothing matters but price.
Life is a cycle and so are markets. 1274 a key level(ES 6-27-11). (That whole week and month after that date is a great read if new to trading/this site.)
You realize there's the potential for a severe crash here and now or early next week. Is this a correction lift or a 5th wave(which can always be truncated- a lower high than 3rd wave at 1360 area.)
Maybe the hand can keep the lift going until later in the year or new year. Maybe not. 1379.25 the measured target.
1283.25 above R level to break and hold for higher.
Targets above are 1294,1302, and 1320 if it does.
It can always go higher and still be negative if diversions created.
Below 1274 are 72.50, 1260-62, 1255, and 1250.
Parabolic move up. I do use trendlines.
Just some thoughts.
1274-1283
TV: best month on S&P since 1974
Emini Day Trading /
Daily Notes /
Forecast /
Economic Events /
Search /
Terms and Conditions /
Disclaimer /
Books /
Online Books /
Site Map /
Contact /
Privacy Policy /
Links /
About /
Day Trading Forum /
Investment Calculators /
Pivot Point Calculator /
Market Profile Generator /
Fibonacci Calculator /
Mailing List /
Advertise Here /
Articles /
Financial Terms /
Brokers /
Software /
Holidays /
Stock Split Calendar /
Mortgage Calculator /
Donate
Copyright © 2004-2023, MyPivots. All rights reserved.
Copyright © 2004-2023, MyPivots. All rights reserved.