ES SRs and Fibs for 11/17/11
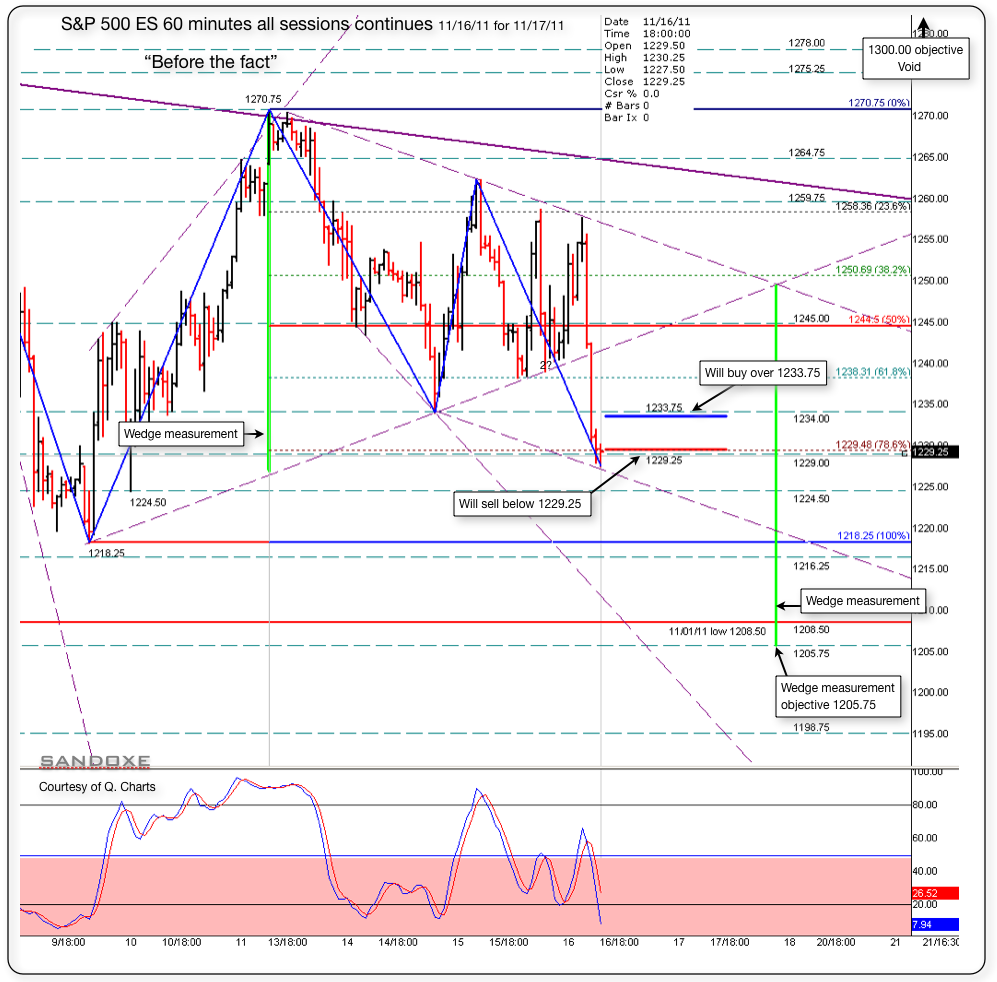
Below is a 60 minutes chart with the S/Rs for night and day traders.
Above 1233.75 I will be buying and focusing on uptrend.
if, below 1229.25, I will be selling and focusing on down trend.
Notice that in the chart there's a wedge and the measurement objective is down at 1205.00. Will see if it give it to us.
Later I will post the follow up chart for the 11/16/11 sessions. I try to play both sessions but by 14:00 I was too tire. lol
The market has the last word and in due time will show us the real deal in dollars and cents.-.
Right now, next hours, next days, next weeks, next months and next years to come, I see for you the same I see for my self: Having the very best of luck, fun, awesome, and incredibly profitable trading experience!!
Click image for original size
I'm fine with that Sandoxe but I can't stop anybody from voting on each post.
Thx DT. In the world of trading, votes are the list of my concerns.
I do need it to clear that up today. People are going to come with "their secrets" But what they don't know is that in the trading industry, there no secrets. I assure you it has being done before!
But new people don't know that, and they are gullible and they think that that's the magic bullet LOL Till they own it and find out that it was not!
I love what is taking place, so much learning, in every direction...........
Thank you again DT.
Emini Day Trading /
Daily Notes /
Forecast /
Economic Events /
Search /
Terms and Conditions /
Disclaimer /
Books /
Online Books /
Site Map /
Contact /
Privacy Policy /
Links /
About /
Day Trading Forum /
Investment Calculators /
Pivot Point Calculator /
Market Profile Generator /
Fibonacci Calculator /
Mailing List /
Advertise Here /
Articles /
Financial Terms /
Brokers /
Software /
Holidays /
Stock Split Calendar /
Mortgage Calculator /
Donate
Copyright © 2004-2023, MyPivots. All rights reserved.
Copyright © 2004-2023, MyPivots. All rights reserved.