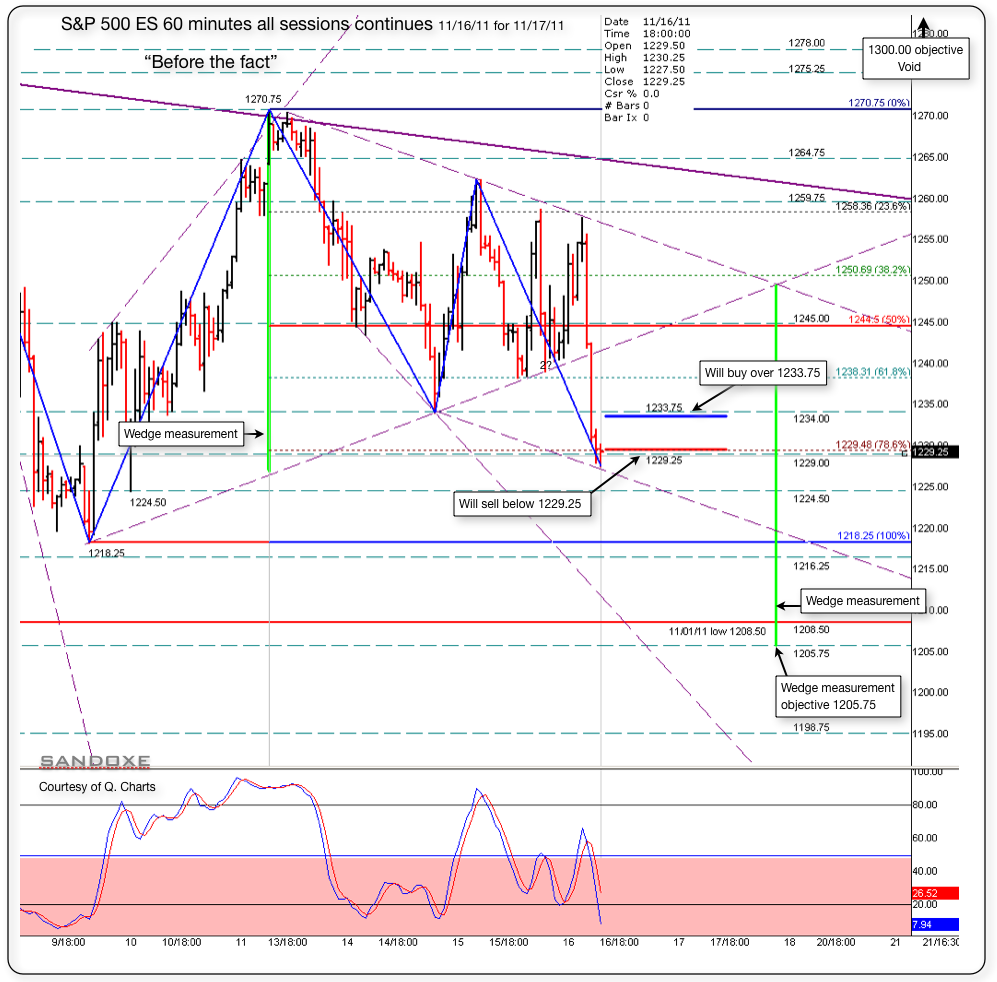
ES SRs and Fibs for 11/17/11
Below is a 60 minutes chart with the S/Rs for night and day traders.
Above 1233.75 I will be buying and focusing on uptrend.
if, below 1229.25, I will be selling and focusing on down trend.
Notice that in the chart there's a wedge and the measurement objective is down at 1205.00. Will see if it give it to us.
Later I will post the follow up chart for the 11/16/11 sessions. I try to play both sessions but by 14:00 I was too tire. lol
The market has the last word and in due time will show us the real deal in dollars and cents.-.
Right now, next hours, next days, next weeks, next months and next years to come, I see for you the same I see for my self: Having the very best of luck, fun, awesome, and incredibly profitable trading experience!!
Click image for original size
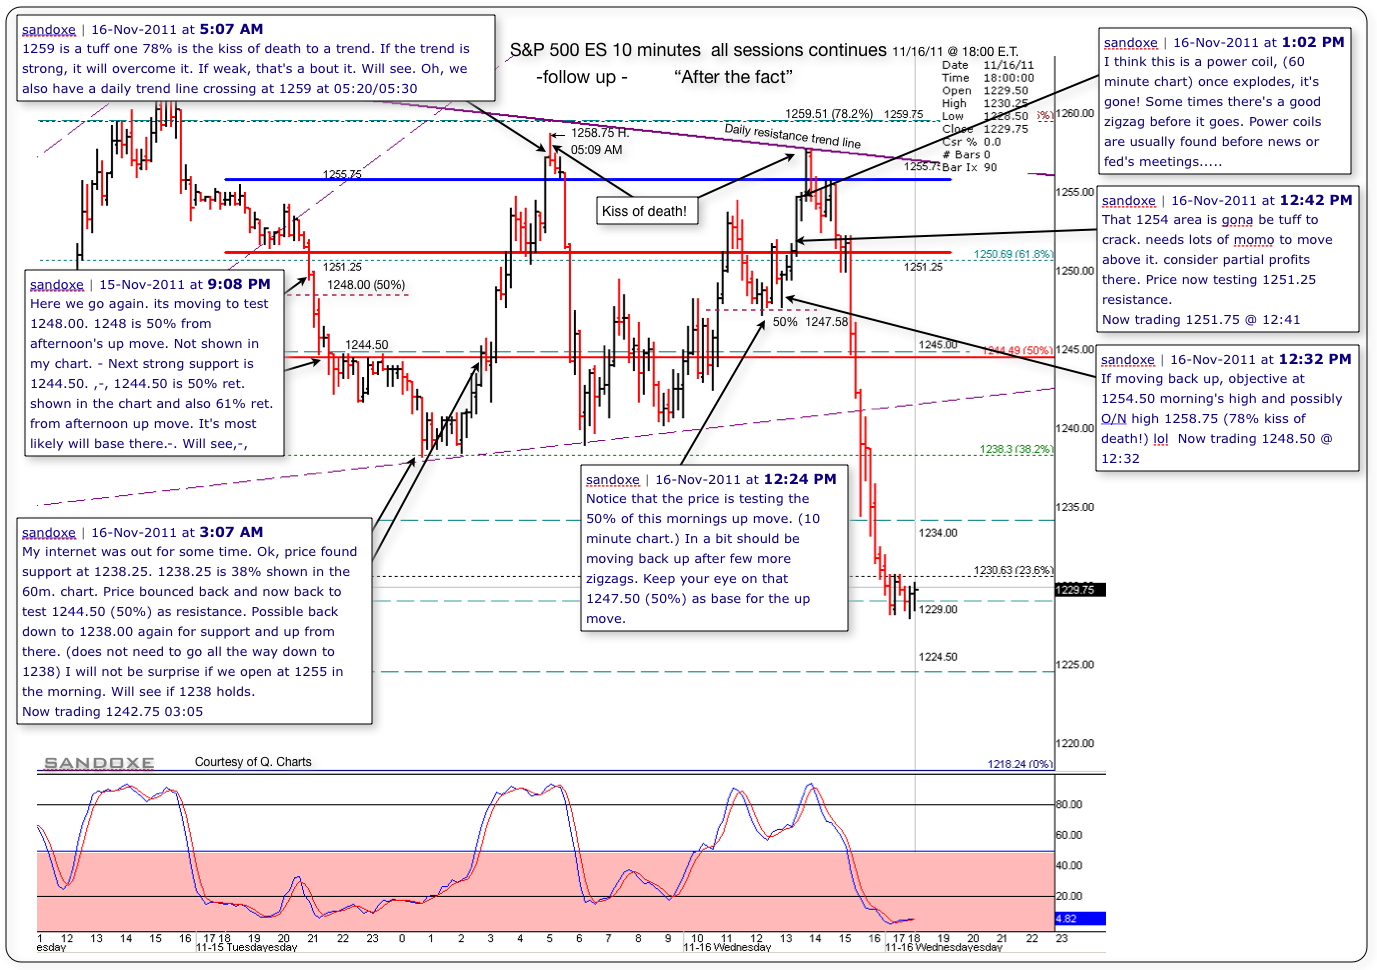
THE KISS OF DEATH for a trend! -- Below is a 10 minutes follow up chart for the last overnight and daily sessions. Notice that in two occasions the intraday trend got stop by the "Kiss of death" and the market reversed very fast. I copied and pasted some of my comments chronologically so you can see in real time what I was seeing at the time.
Below the 10 minute "after the fact" chart is the original 60 minutes "before the fact" chart posted yesterday.
Very interesting how people see things. There where other posts, two by MM one was a chart and his numbers with a low at 1224/23 Tonight's low so far, is at 1225.00. -- From a different perspective, DaviS posted one of his numbers at 1225.50! -- Lisa posted warnings at key areas with charts and they where right on the money! -- Redsixspeed, posted fibs extensions that I did not had in my chart and they where exact!
It's an honor to post with professional people!
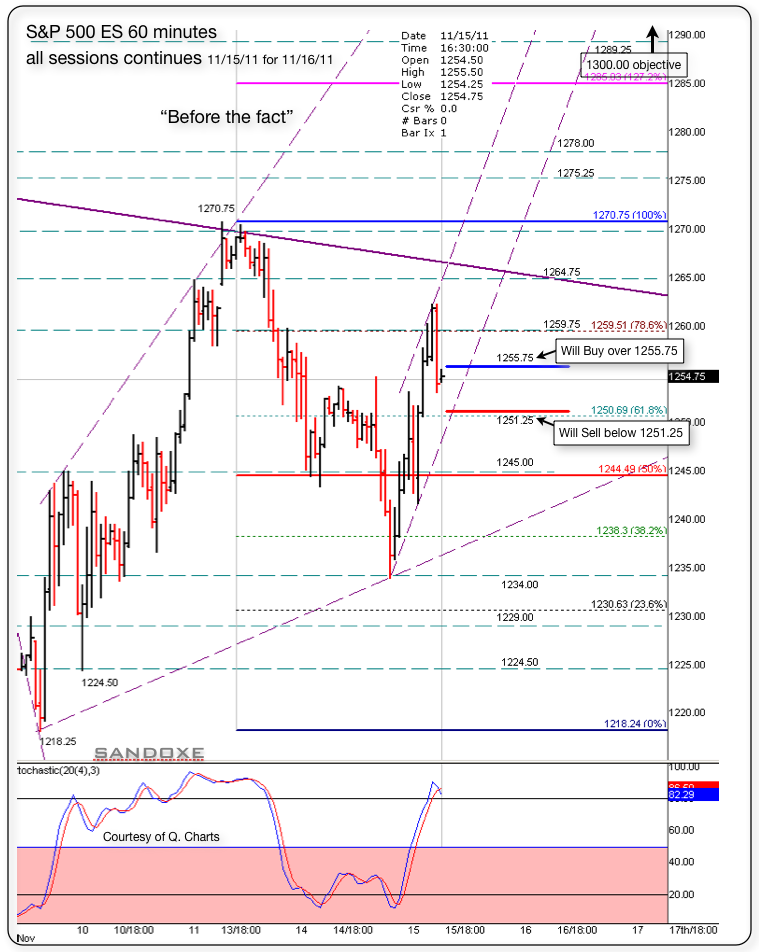
Click image for original size
Click image for original size
That 1238 area is a wall! Lots of resistance there. If long consider partial profits in this area. Needs lots of momo to overcome it.
I think that in general we are in wave 4 of 5 down. At some point it will reverse and move down to test the recent low at 1225.75. and 1218 next support.
Now trading 1236.25 00:27
I think that in general we are in wave 4 of 5 down. At some point it will reverse and move down to test the recent low at 1225.75. and 1218 next support.
Now trading 1236.25 00:27
Do you notice how fast the ticker moves when it hit the resistance? LOL Still testing it. If above, then will test as support. Will see.
Few zigzags 3+ -3 point range. Will see the market will show us the way.
Now trading 1238.75 00:50
Few zigzags 3+ -3 point range. Will see the market will show us the way.
Now trading 1238.75 00:50
GM,sandoxe
1220.00 is the projected # ... 1220.50 is the confirmation #
KoolBlue is great to learn from, if projection is in your trading strategy ...
prior low @ 1218.25
Market has rallied only in 3 waves. Should at least get a 78% retracement for a b wave before a buy sets up.
If we are going to make new lows on the S & P later in the morning, support is at 1214.50 and 1205-06 and 1198.
Floor resistance remains 1238.50 plus slippage. Support at 1223.25 is a better buy. Market needs to take out 1234 to issue a stronger buy signal.
Key resistance now at 1243.25 and much above there we could see 1250.
i follow EW to some extent.
redsixspeed, what swing where you using to project 220 ? thanks !
Originally posted by redsixspeed
1220.00 is the projected # ... 1220.50 is the confirmation #
no swing .. projections are from a spot # .. I just added a twist to the swing projections to my study of Nison ...
Thx DT. In the world of trading, votes are the list of my concerns.
I do need it to clear that up today. People are going to come with "their secrets" But what they don't know is that in the trading industry, there no secrets. I assure you it has being done before!
But new people don't know that, and they are gullible and they think that that's the magic bullet LOL Till they own it and find out that it was not!
I love what is taking place, so much learning, in every direction...........
Thank you again DT.
Emini Day Trading /
Daily Notes /
Forecast /
Economic Events /
Search /
Terms and Conditions /
Disclaimer /
Books /
Online Books /
Site Map /
Contact /
Privacy Policy /
Links /
About /
Day Trading Forum /
Investment Calculators /
Pivot Point Calculator /
Market Profile Generator /
Fibonacci Calculator /
Mailing List /
Advertise Here /
Articles /
Financial Terms /
Brokers /
Software /
Holidays /
Stock Split Calendar /
Mortgage Calculator /
Donate
Copyright © 2004-2023, MyPivots. All rights reserved.
Copyright © 2004-2023, MyPivots. All rights reserved.