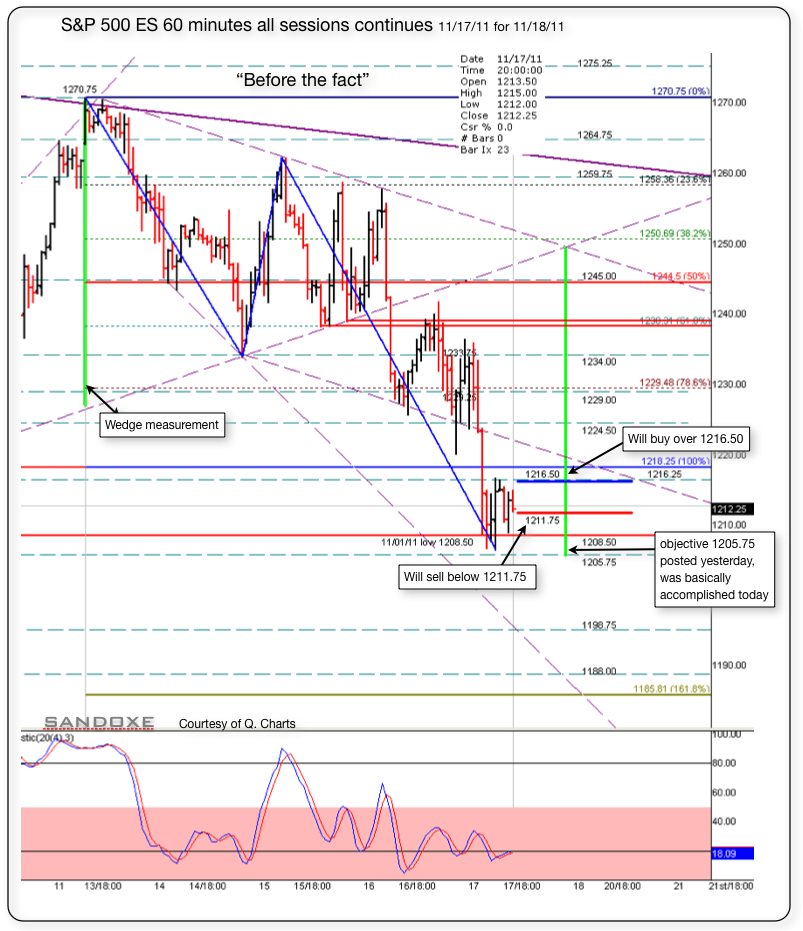
Below is the 60 minutes chart with the set up for night and day trading. It's possible that will test that 1205 again. Failure there will have 1198 as next objective, below that 1185 1.618% Fib ext.
Will see, and as always, the market has the last word and in due time will show us the real deal in dollars and cents.-.
Right now, next hours, next days, next weeks, next months and next years to come, I see for you the same I see for my self: Having the very best of luck, fun, awesome, and incredibly profitable trading experience!!
Click image for original size