ES SRs and Fibs for 11/18/11
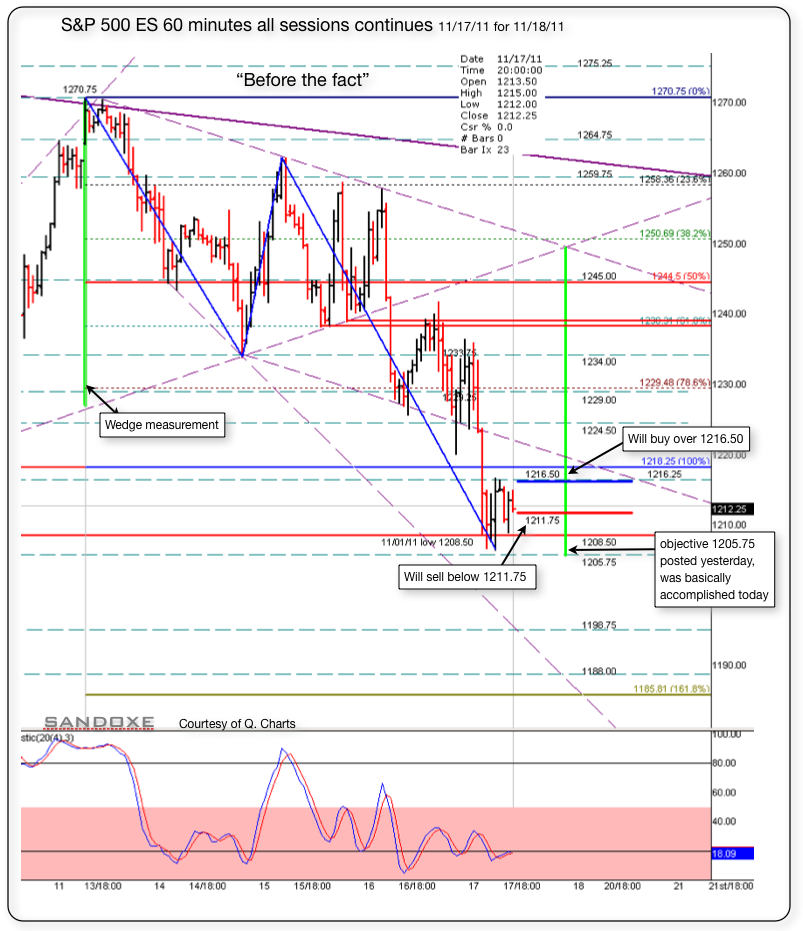
In the chart posted yesterday I had an objective at 1205. The objective was basically done today (The low was 1206.50) Did got zigzag few times in the day session but made it Ok at the end.
Below is the 60 minutes chart with the set up for night and day trading. It's possible that will test that 1205 again. Failure there will have 1198 as next objective, below that 1185 1.618% Fib ext.
Will see, and as always, the market has the last word and in due time will show us the real deal in dollars and cents.-.
Right now, next hours, next days, next weeks, next months and next years to come, I see for you the same I see for my self: Having the very best of luck, fun, awesome, and incredibly profitable trading experience!!
Click image for original size
since the open, we have been bouncing between the high volume area from yesterday (11 to 14 or so) and the bottom of the huge low volume zone created as we moved down yesterday afternoon (18 to 24 area)
so bears would want to keep prices below that low volume zone in the bottom distribution from yesterday... a move inside that area could quickly take us to the other end of that low vol zone, including a single print at 23
so bears would want to keep prices below that low volume zone in the bottom distribution from yesterday... a move inside that area could quickly take us to the other end of that low vol zone, including a single print at 23
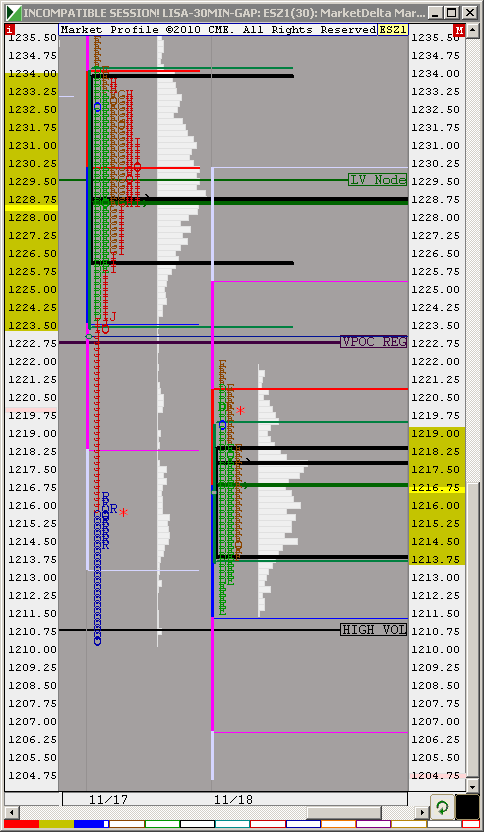
looks like a thin vol sideways boring day?
maybe they were waiting for Eurozone to clsoe
going out - be back after 2
wow sat down to meditate and fell a sleep lol
Ok, looking at the 60 minutes chart we are on a sell mode and progressively moving down towards yesterday's low.
Ok, looking at the 60 minutes chart we are on a sell mode and progressively moving down towards yesterday's low.
IN your 60 minutes all sessions chart, trace a support trend line. If violate, is most likely will go to test 1206.50
Hit 1208.50 and bounced back just like yesterday, after the bounce is done, 1206.50 is next Consider taking partials there. Next objective below that is 1198,00. The trend line you draw earlier in the 60 minutes chart is the voiding point to the down side. IN other words, if price moves above that trend line, temporarily voids the down side objectives.
ES now trading 1211.50 @ 12:14
ES now trading 1211.50 @ 12:14
Originally posted by sandoxe
IN your 60 minutes all sessions chart, trace a support trend line. If violate, is most likely will go to test 1206.50
nq made a new low es did not
Is gonna take a bit of time to get there vasuki,
Every down impulse is being counteracted to hold the speed of decline. Much money is coming in just to hold the market at bay,,,,
Every down impulse is being counteracted to hold the speed of decline. Much money is coming in just to hold the market at bay,,,,
Thank you everyone for sharing your way of seeing, it was an outstanding week!!!!
I see for you and yours, the same I see for my self: Having an awesome, fun, enjoyable, weekend!!
I see for you and yours, the same I see for my self: Having an awesome, fun, enjoyable, weekend!!
Emini Day Trading /
Daily Notes /
Forecast /
Economic Events /
Search /
Terms and Conditions /
Disclaimer /
Books /
Online Books /
Site Map /
Contact /
Privacy Policy /
Links /
About /
Day Trading Forum /
Investment Calculators /
Pivot Point Calculator /
Market Profile Generator /
Fibonacci Calculator /
Mailing List /
Advertise Here /
Articles /
Financial Terms /
Brokers /
Software /
Holidays /
Stock Split Calendar /
Mortgage Calculator /
Donate
Copyright © 2004-2023, MyPivots. All rights reserved.
Copyright © 2004-2023, MyPivots. All rights reserved.