ES Friday 20/Jan/2012
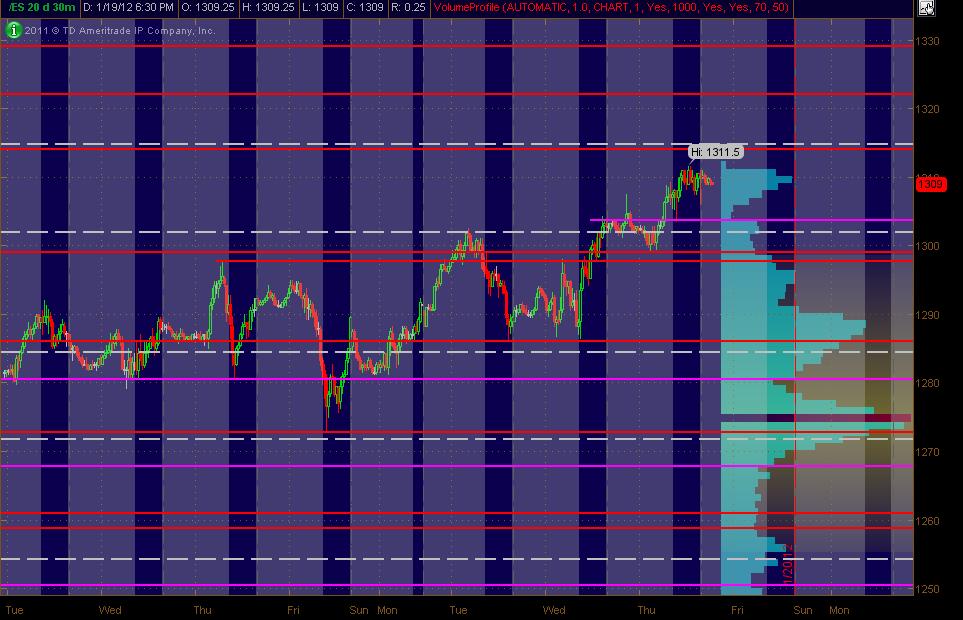
Here's what I've got for my ES MAP of PASR ZONES using a 30min chart of 20 days of data coming into Friday's trading. The Red lines are potential significant levels with Magenta lines as semi-significant. The White dashed lines are the Weekly Pivots (kind of a background thing to have on the chart). The Light Blue Volume Profile of the past "rolling" 20 days is displayed on the right vertical axis. Btw, price lines that are CLOSE together (within a couple of points), should be taken as an overall ZONE. The Gray background shows non-RTH price activity. Hope, as always, that this is helpful to some as a "MAP."
BEWARE OPEX ... lotta cross-currents in mkt.
MM
Click image for original size
BEWARE OPEX ... lotta cross-currents in mkt.
MM
Also, here's something that was offered out a while back free for SP tendencies by Quantum Charts regarding OPEX Friday:
Their website is www.quantumcharts.com where they offer a trading/research software package along with other things such as reports like the one above.
MM
Click link to access uploaded file:
SP OpEX Trade Quantum Charts.doc
SP OpEX Trade Quantum Charts.doc
Their website is www.quantumcharts.com where they offer a trading/research software package along with other things such as reports like the one above.
MM
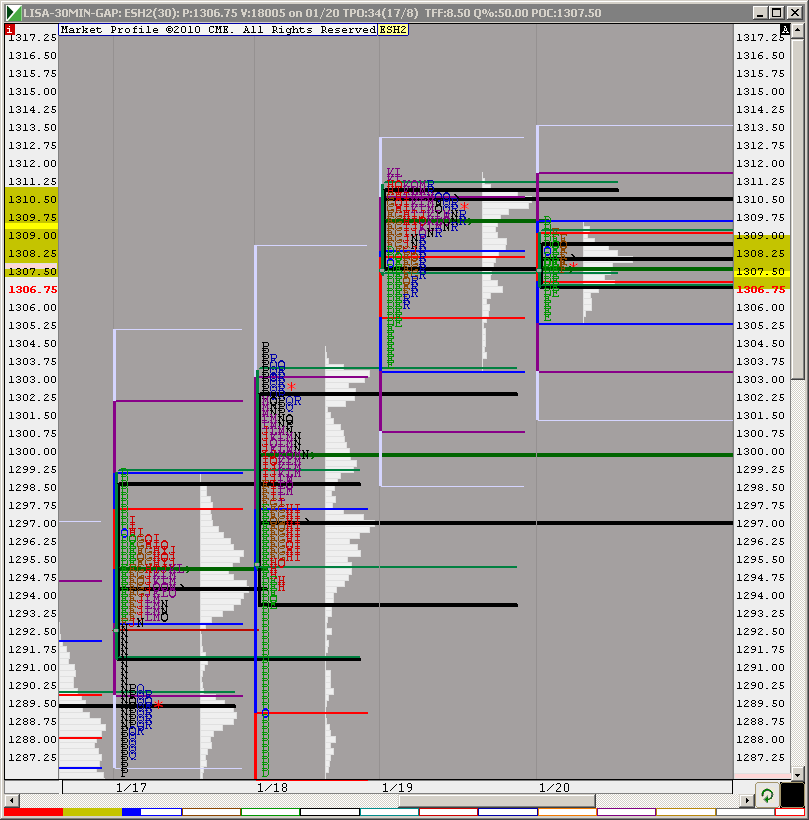
same numbers as yeaterday with even more emphasis on the 1307 - 1309 area.....
Originally posted by BruceM
same numbers as yeaterday with even more emphasis on the 1307 - 1309 area.....
Would love to see an open in the 05 area to sell 07.50-08.25
Good luck to all!
What is there in the 7.5-8.25 area BigMike ? I see the O/N POC and O/N peak volume in the area, is that why you mentioned it ? Just trying to incorporate some of these MP concepts/strategies into my trading.
Thank you in advance
Thank you in advance
Originally posted by Big Mike
Originally posted by BruceM
same numbers as yeaterday with even more emphasis on the 1307 - 1309 area.....
Would love to see an open in the 05 area to sell 07.50-08.25
Good luck to all!
Originally posted by ayn
What is there in the 7.5-8.25 area BigMike ? I see the O/N POC and O/N peak volume in the area, is that why you mentioned it ? Just trying to incorporate some of these MP concepts/strategies into my trading.
Thank you in advance
Originally posted by Big Mike
Originally posted by BruceM
same numbers as yeaterday with even more emphasis on the 1307 - 1309 area.....
Would love to see an open in the 05 area to sell 07.50-08.25
Good luck to all!
O/N and yesterday's midpoints
Lay of the land. Volume above , air below
Click image for original size
tough day to trade.
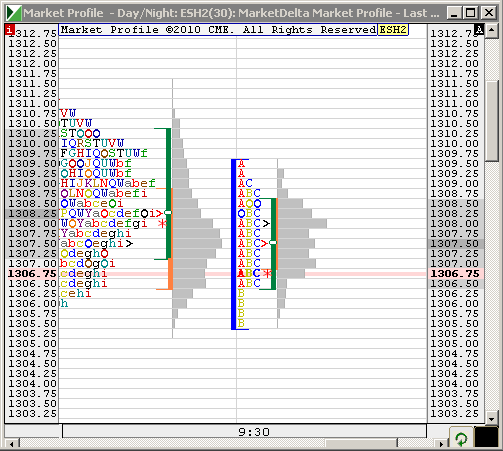
Ayn, instead of using O/N mid-point, I use O/N VA and related numbers, such as O/N POC (I use volume) and O/N HVA and LVA. I see many times HVA and LVA used for turn-around points by RTH traders. Today, I am doing nothing while we are in O/N VA area.
Below is my chart. Hope it is useful.
Below is my chart. Hope it is useful.
Click image for original size
no clue as I have never followed those markets...sorry!
Emini Day Trading /
Daily Notes /
Forecast /
Economic Events /
Search /
Terms and Conditions /
Disclaimer /
Books /
Online Books /
Site Map /
Contact /
Privacy Policy /
Links /
About /
Day Trading Forum /
Investment Calculators /
Pivot Point Calculator /
Market Profile Generator /
Fibonacci Calculator /
Mailing List /
Advertise Here /
Articles /
Financial Terms /
Brokers /
Software /
Holidays /
Stock Split Calendar /
Mortgage Calculator /
Donate
Copyright © 2004-2023, MyPivots. All rights reserved.
Copyright © 2004-2023, MyPivots. All rights reserved.