JI
jimkane
Rep: 3,058
Posts: 33,089
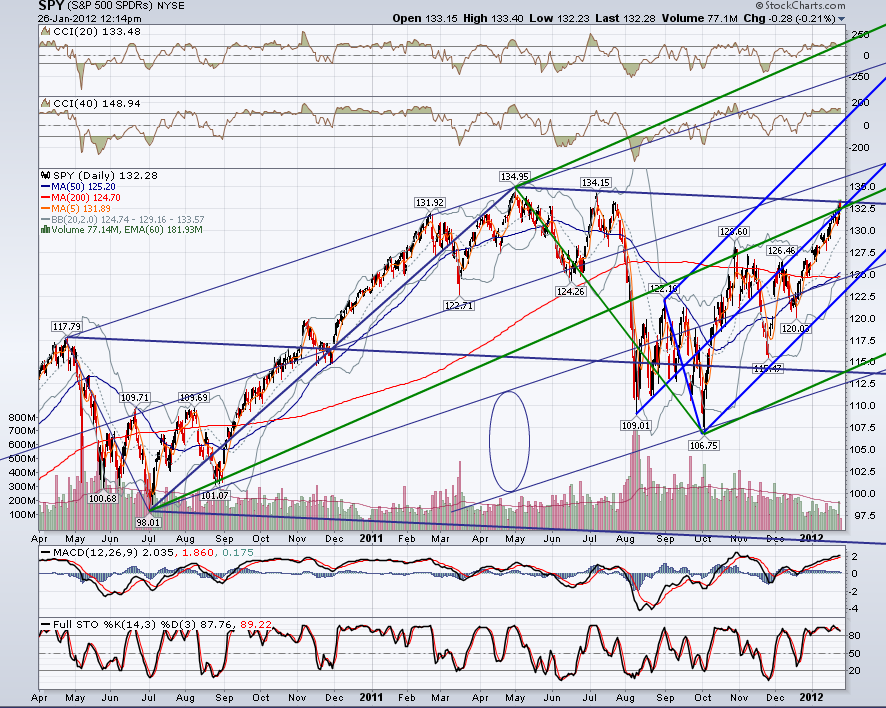
Here's a thought. When did the first correction start after the 2009 bottom? Let's say April/May 2010. And the next correction? April/May 2011. Maybe this thing goes up until April/May 2012, then corrects, then big up until the election. By then it would be not only at new all-time highs, but way new all-time highs. This is based on some of my own cycle work, and some common sense. I think it is, by far, the highest odds scenario.
They seem to have the kick the can down the road scheme down to a science, far beyond anything I ever could have imagined. Unless something happens that is just too much for the system I think they have a lot longer to go on this game than I thought. It seemed so precarious that I thought it would hit a tipping point any time now (my most probable time was Q1 2012). Now I think they could possibly easily go another 5-10 years or more. By then we won't recognize the world, our country, or our lifestyles, but that matters not to them one bit. So what. Hence, I think that is now becoming the most likely scenario. It makes me want to puke, literally, but it is what it is.
So, get ready for some possible big down dollar moves, huge gold and silver upmoves, and some new all-time highs in the stock market. It won't happen without big corrections on the way, but I can't see a 'bear market' until well after new all-time highs and the election. We'll see. Not a prediction, just some thinking out loud. I hope it plays out dead opposite...
JI
jimkane
Rep: 3,058
Posts: 33,089
There is a slather of 'sub-levels' in here from 20.25-22.25. Although I think this is now headed up a bit (short-term intraday), this is the level it has to clear to be free to move back up. It's all the zone for various bearish ABCDs.
JI
jimkane
Rep: 3,058
Posts: 33,089
Can anyone show, in the ES all-sessions, why the HOD this AM was the high I was looking for to the tick. One line only. No Fibs. No sets. I don't mean I didn't do a full workup, only that the line was the guide for the high, and it hit it to the tick.
JI
jimkane
Rep: 3,058
Posts: 33,089
Anyone notice this little 1-min checkback here to the .382 so far started at... 20.25?
JI
jimkane
Rep: 3,058
Posts: 33,089
And yes, I just changed the above grouping from 20.50 to 20.25 not because it hit 20.25, but because it was a typo. Anyone who does the work as I do can see it was indeed 20.25.
JI
jimkane
Rep: 3,058
Posts: 33,089
Now, if this gets going to the downside, I'm watching 14-15 area next.
JI
jimkane
Rep: 3,058
Posts: 33,089
So, watch the GZ coming up in here and let's see if they are gaming, or are serious.
JI
jimkane
Rep: 3,058
Posts: 33,089
GZ hit. Big clue time to see what they intend. To see if that was 'the top'.
JI
jimkane
Rep: 3,058
Posts: 33,089
Originally posted by jimkane
Now, if this gets going to the downside, I'm watching 14-15 area next.
JI
jimkane
Rep: 3,058
Posts: 33,089
rat, I'm not sure if I defined them in here or not, but the terms I use are in the AFTC book. I follow Miner's convention. I don't use 'extension' as a term at all. We all know what retracements are. 'Internal' means less than 100%, 'external' means greater than 100%. A price projection uses three points, like A, B, and C of an ABCD. It takes the move from points 1 and 2 and multiplies that by a Fib ratio and adds it to point 3, to get point 4. I also use expansion, which is a two point tool, and starts out like a price projection, using points 1 and 2, but after doing the ratio it adds it to point 2 instead of point 3. This is clearly explained in AFTC, with diagrams, so I refer you back to that book.
Originally posted by rat89
Jim, you once clarified the difference between projection and extension here....I can't find it, and I get mixed up in terms....could you point me to it again?