JI
jimkane
Rep: 3,058
Posts: 33,089
Yes, I'm being sarcastic (Oops, wait, I said awhile back I would stop doing that, as it was confusing some people, as much as I felt it was a big part of how I teach...). Yes, I think the valuation is ridiculous. Yes, I think this market endlessly rising is ridiculous. And yes, I think it is actually possible.
JI
jimkane
Rep: 3,058
Posts: 33,089
BTW, it's a little hard to be bearish when looking at the price action. Yes, we will have a swift, sharp, stunning selloff, and it may come any second, but until I see this moving down past the very first tiny little area, I'm strongly (strongly) long side bias.
AL
albert
Rep: 99
Posts: 3,094
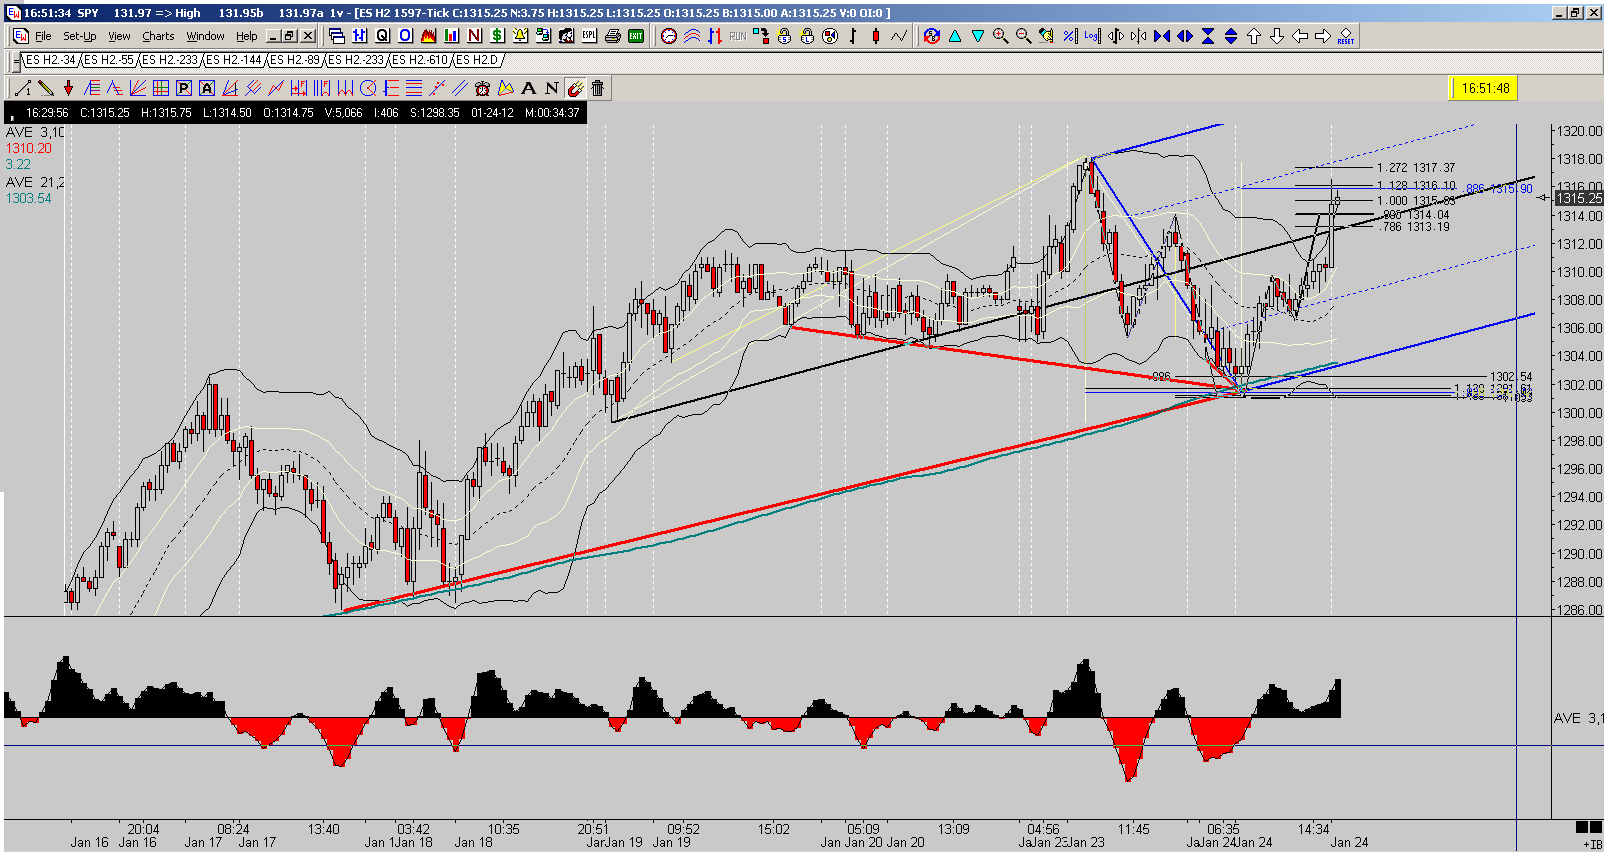
No gap on 5, but 0.886 and 1.128 fibos confluent with several SLs, with 200 SMA touch. Thank you Jim and all the Kane Traders for their excellent posts. I feel I am learning a lot here.
Al Kamego
Al Kamego
Click image for original size
JI
jimkane
Rep: 3,058
Posts: 33,089
Ah, they really disappointed me. High print by my data was just under 470, up almost 50, but it drifted well down from there, up, what, only 32 from the RTH close now? That's not too impressive. Hopefully it will hit 500 tomorrow when the most owned stock by hedge funds in the entire world opens up and they realize they don't own enough of it. We'll see.
Originally posted by jimkane
I wonder where AAPL will open back up? Up 50? Up 100?
JI
jimkane
Rep: 3,058
Posts: 33,089
So, let's see what the ES does around 22.50-23.00 up to around 26 or so. These are two 'sub-levels', but they define the area pretty well. I have little doubt it will try to shoot for that in the overnight or AM session. It's what it does there that really interests me.
JI
jimkane
Rep: 3,058
Posts: 33,089
Okay, I'm done posting for tonight, so I'll get this out there for later:
There it is!!!
That's for when it takes out that high and heads to the area(s) mentioned in the last post. And if it doesn't do it (yeah, that's likely), then I'll have to admit tomorrow how surprised I am by that.
There it is!!!
That's for when it takes out that high and heads to the area(s) mentioned in the last post. And if it doesn't do it (yeah, that's likely), then I'll have to admit tomorrow how surprised I am by that.
JI
jimkane
Rep: 3,058
Posts: 33,089
No posts? Okay, my last post didn't happen, it rolled straight down from there, and yes, totally surprised me.
Now the FED is out with their statement, low rates for three more years at least, after three years so far. Great. Poor, poor savers and middle class... Gold likes it, of course. Look at a tick chart on that one.
Now the FED is out with their statement, low rates for three more years at least, after three years so far. Great. Poor, poor savers and middle class... Gold likes it, of course. Look at a tick chart on that one.
JI
jimkane
Rep: 3,058
Posts: 33,089
It took the FED announcement to give them the Oomph to get the new highs and the next area? Or will this bearish ABCD right here turn it down???
JI
jimkane
Rep: 3,058
Posts: 33,089
And yes, that bearish ABCD would have a wicked 1-min/tick chart ABCD in its CD leg. Hence, I'm very cautious with it.
JI
jimkane
Rep: 3,058
Posts: 33,089
8.50-9.25 (best line at 9.25) here is a big clue time. Can they turn it back up?
JI
jimkane
Rep: 3,058
Posts: 33,089
rat, I'm not sure if I defined them in here or not, but the terms I use are in the AFTC book. I follow Miner's convention. I don't use 'extension' as a term at all. We all know what retracements are. 'Internal' means less than 100%, 'external' means greater than 100%. A price projection uses three points, like A, B, and C of an ABCD. It takes the move from points 1 and 2 and multiplies that by a Fib ratio and adds it to point 3, to get point 4. I also use expansion, which is a two point tool, and starts out like a price projection, using points 1 and 2, but after doing the ratio it adds it to point 2 instead of point 3. This is clearly explained in AFTC, with diagrams, so I refer you back to that book.
Originally posted by rat89
Jim, you once clarified the difference between projection and extension here....I can't find it, and I get mixed up in terms....could you point me to it again?