ES Monday 23/Jan/2012
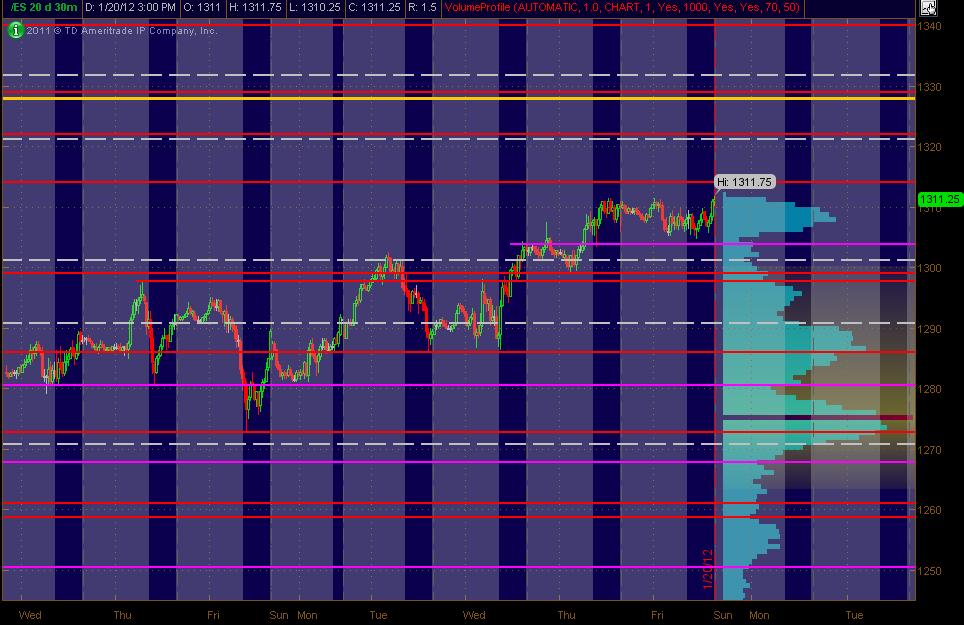
Here's what I've got for my ES MAP of PASR ZONES using a 30min chart of 20 days of data coming into Monday's trading. The Red lines are potential significant levels with Magenta lines as semi-significant. Also, I've drawn in a Yellow line that's a Fib cluster. The White dashed lines are the Weekly Pivots (kind of a background thing to have on the chart). The Light Blue Volume Profile of the past "rolling" 20 days is displayed on the right vertical axis. Btw, price lines that are CLOSE together (within a couple of points), should be taken as an overall ZONE. The Gray background shows non-RTH price activity. Hope, as always, that this is helpful to some as a "MAP."
MM
Click image for original size
MM
Primary S/R ZONES I'm looking at:
1328-29 PASR / Fib Cluster
1321-22 PASR / Wkly Pvt
1314 PASR / Daily R1 / DeMark Daily R1
1304 Minor PASR / DeMark Wkly Mid Pvt / rolling 20 Day VolProf LVN
1398-99 PASR zone
As per Thinkorswim calculations, I noticed that the 1 and 2 day(s) Volume Profiles do not have HVN or LVN areas that correspond with the listed levels here (shown on the 30min chart above on prior post).
Hmmmm?
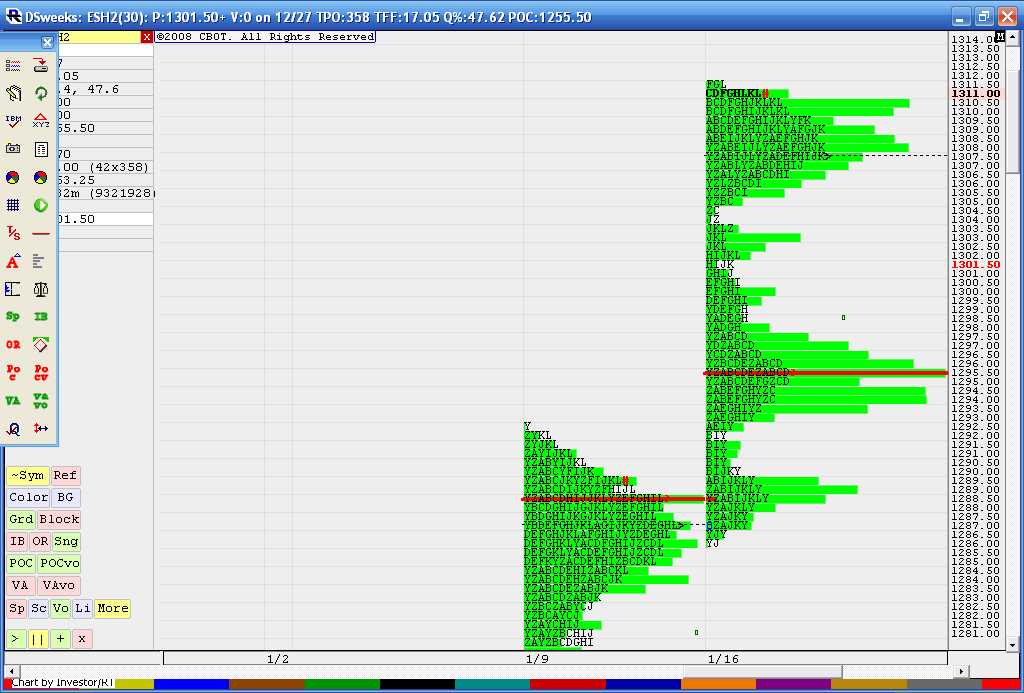
I thought it might be fun to compare the levels posted by MM and the ones i'm posting from just the day session only combined to form a weekly profile. I had to scale this chart to fit it as I wanted to also include the last part of the week before which shows that nice little bell curve. I've listed the key ares out and you can compare them on the chart if you like but they may be off slightly due to scaling
1310.50 HV node
1307.75 weekly POC
1302 - 1304 LV node
1295.50 peak volume price
1292.50 LV node
1288 - 1289 HV node
1310.50 HV node
1307.75 weekly POC
1302 - 1304 LV node
1295.50 peak volume price
1292.50 LV node
1288 - 1289 HV node
Click image for original size
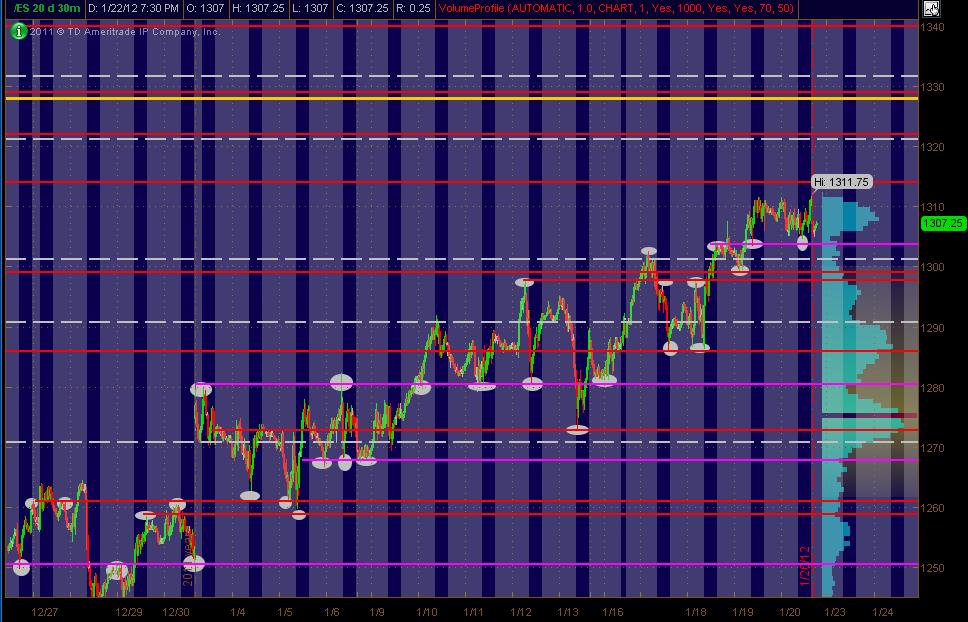
Just thought I'd toss out a "tutorial" (for lack of a better word) that shows where/how I drew in most of the PASR price levels/lines on the ES 30min chart. The levels above are pulled from analysis of the Daily chart.
Like I've always said, these S/R maps ain't rocket science! But function as a decent map, especially when combined with other analysis.
Bruce's numbers are almost always spot-on! And I'd encourage anyone to pay attention to his for ES trading ... he truly reads the market. I create my map for mostly my equity trading ... to gauge when and where are high or low risk entries on individual stocks based on how they are behaving on a relative strength basis compared to the ES.
It's always nice to see multiple analysis, especially when price levels coming into a trading session have overlap/confluence. As for ES understanding and analysis, I've not run across anyone who shows trades in real-time AND EXPLAINS THE ANALYSIS as Bruce does- PERIOD!
And it's fukkin' FREE!
Click image for original size
I have a downward bias and a small Overnight short working from 1310.75.... on Friday the Dow closed up 96 points but the S&P barely a point...the Naz closed down..so a big divergence..
Nice little volume spikes in the overnight at the 08 - 09 area to confirm that area...so that is the critical magnet early on...I'm hoping they run the market up first in the day session to get a better short on...the reason for the early small trade now is because I don't want to miss the short side in case they just open it up and drop it..
Better shorts come in up at 1312.50 to 1315...this would push out the overnight highs and break out from last weeks highs...
In general this pattern of higher highs seems to be getting a bit old now on the daiily charts.
lets see what the pitbull gives us and the segment count
this is the fake out move up I believe...08 is a strong magnet
other volume spike from O/N is 1312.50...so watch that..fading up here at 1315.25..plus 4 is hit!!!
adding at 16.25...where is the segment count ?? it's on bar number 4 !!
that's 5 higher lows in day session.....where is plus 4 - 5.5 zone...?
air at 1314
air at 1314
added at 17.50..interesting so far..getting close to the plus 8 number...9 bars up in a row is the ultimate far end of segment count...very rare if it happens!!
revising target to 15.25 as that is first entry in DAY session!
revising target to 15.25 as that is first entry in DAY session!
wow, they breezed thorugh those levels...i guess the early longs gave up on their trade long before we got to the bottom of the buying tail
we are now accepting value inside last week's value area and also in weekly terms today's move can be seen as a failed breakout of last week's highs, so taht is sthg to pay attention to
we are now accepting value inside last week's value area and also in weekly terms today's move can be seen as a failed breakout of last week's highs, so taht is sthg to pay attention to
Originally posted by NickP
10.25 is the bottom of the buying tail that drove us higher from the open and coincides witht eh 10.5 peak volume from last week that bruce mentioned earlier...it will be interesting to see if they attempt a break of the lower edge of the ib...we should see some good fight there i would think
Emini Day Trading /
Daily Notes /
Forecast /
Economic Events /
Search /
Terms and Conditions /
Disclaimer /
Books /
Online Books /
Site Map /
Contact /
Privacy Policy /
Links /
About /
Day Trading Forum /
Investment Calculators /
Pivot Point Calculator /
Market Profile Generator /
Fibonacci Calculator /
Mailing List /
Advertise Here /
Articles /
Financial Terms /
Brokers /
Software /
Holidays /
Stock Split Calendar /
Mortgage Calculator /
Donate
Copyright © 2004-2023, MyPivots. All rights reserved.
Copyright © 2004-2023, MyPivots. All rights reserved.