JI
jimkane
Rep: 3,058
Posts: 33,089
Wow, that was a sweet little 1-min bar stop run breakdown there. I love it. Maybe that's all the downside it has, though. You know the games they like to play before they do a Sunday night GLOBEX/Monday run up. But, one of these times we'll get some real downside... It's sure all set up for some right now, as discussed previously. I'm patiently (Hah!) waiting for it...
JI
jimkane
Rep: 3,058
Posts: 33,089
I know this is just playing with ticks when it really goes nowhere in a tiny range, but this 40.75 is the first area off the recent pullback, and it's a battle. Imagine if that was a lower high? It, of course, won't be, but imagine...
JI
jimkane
Rep: 3,058
Posts: 33,089
Yeah, it's not off by a little, it's off huge. Very odd. And if you are trading off that... And what about their other data?
RA
rat89
Rep: 0
Posts: 7,015
here's another....dividends?
Originally posted by jimkane
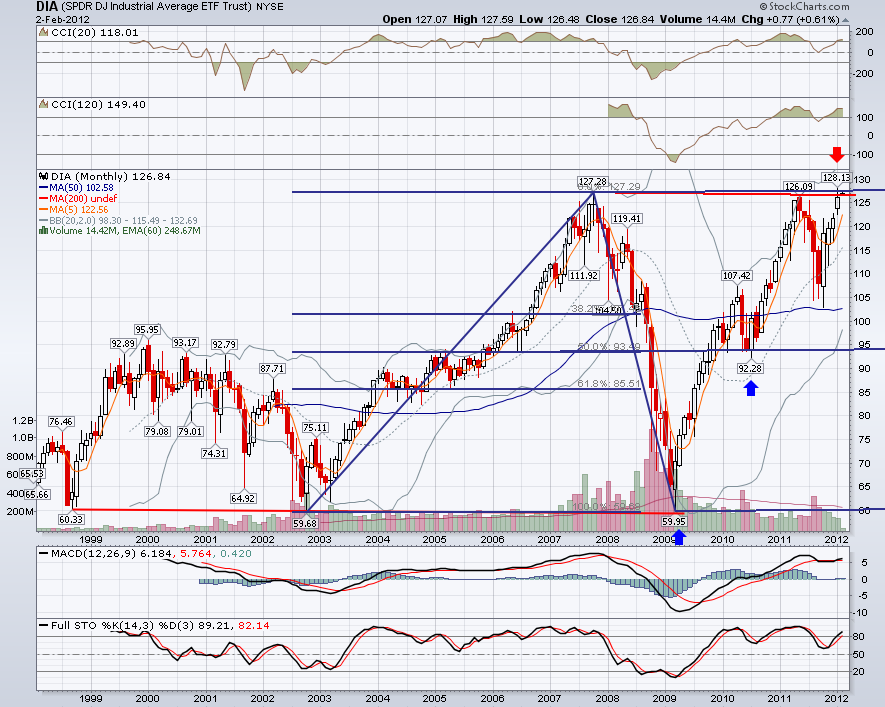
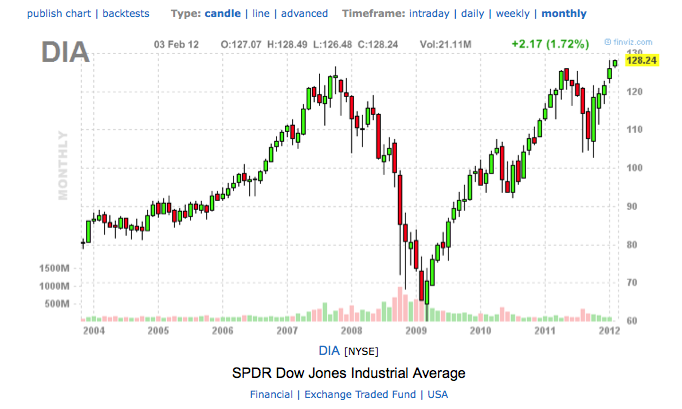
Something is not right there, rat. The 2007 high for DIA was like 141.95. This is confirmed with an $INDU chart. Yet your DIA chart shows the high roughly equal to today's high. I can't believe StockCharts data could be off that much. I looked at this a dozen times, and I must just be looking at the symbol(s) wrong or something...
Originally posted by rat89
you do really have to wonder....
Click image for original size
Click image for original size
JI
jimkane
Rep: 3,058
Posts: 33,089
Yes, I go to Bloomberg and see that same layout. Then I go to Yahoo finance and I see what eSignal shows, which mirrors the $INDU. Here's a link straight form the NASDAQ, which shows the same as eSignal:
http://www.nasdaq.com/symbol/dia/stock-chart?intraday=off&timeframe=6y&splits=off&earnings=off&movingaverage=None&lowerstudy=volume&comparison=off&index=&drilldown=off
So, I don't know, but it is bizarre.
http://www.nasdaq.com/symbol/dia/stock-chart?intraday=off&timeframe=6y&splits=off&earnings=off&movingaverage=None&lowerstudy=volume&comparison=off&index=&drilldown=off
So, I don't know, but it is bizarre.