ES Wednesday 2-22-2012
Click image for original size
Click image for original size
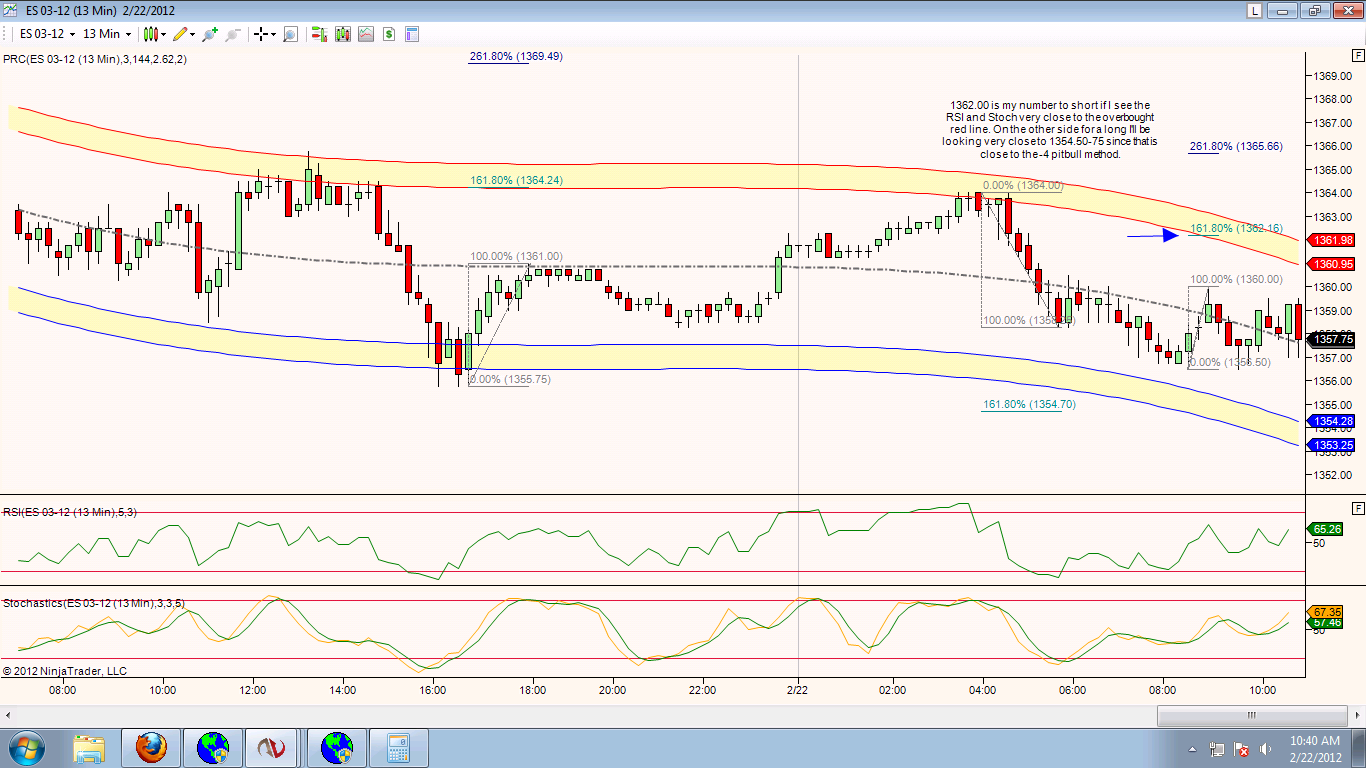
This small range from Open of RTH to now is creating a potential trap that could snap in either direction, but judging by overnight, seems buyers are reluctant.
Interesting VP
Bruce says he uses overnight to confirm RTH levels.
Yesterday's RTH had two bells.
Overnight saw test of upper bell's VP POC rejected (1364.00)
now, price has just tested the lower bell's POC and (1359.75) and it is not getting through it. (see chart below)
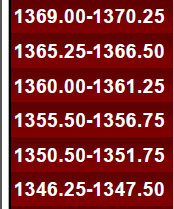
I wonder if those single prints (TPO) from a couple of days ago (1350.50-1348 area will be visited?
Previous day's Low of 1355.75 is still considered support.
Sorry, I have no idea how to trade this open.
Here's yesterday's VP with the two bells (sortof)
seems stymied by the edge of the volume ledge created in the ovenight.
Interesting VP
Bruce says he uses overnight to confirm RTH levels.
Yesterday's RTH had two bells.
Overnight saw test of upper bell's VP POC rejected (1364.00)
now, price has just tested the lower bell's POC and (1359.75) and it is not getting through it. (see chart below)
I wonder if those single prints (TPO) from a couple of days ago (1350.50-1348 area will be visited?
Previous day's Low of 1355.75 is still considered support.
Sorry, I have no idea how to trade this open.
Here's yesterday's VP with the two bells (sortof)
seems stymied by the edge of the volume ledge created in the ovenight.
Click image for original size
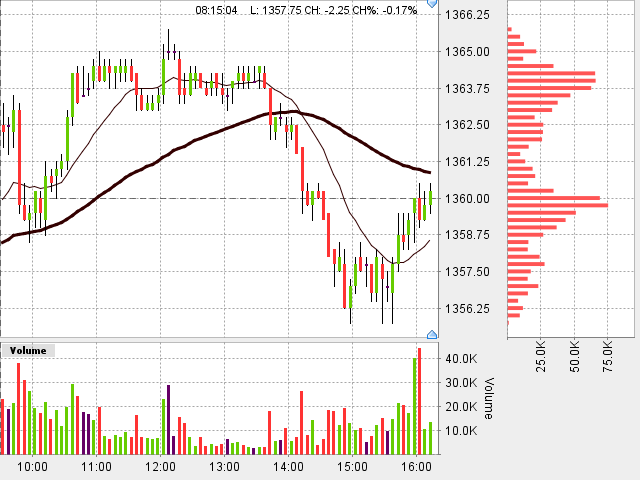
yesterday's L 55.75, tested to the tick and Price bounced.
a move above the 1360 level can be a 'tell.' if big bar on the crossing, shorts trapped and forced to buy.
a move above the 1360 level can be a 'tell.' if big bar on the crossing, shorts trapped and forced to buy.
sorry, I should have been more specific when I said big bar, I should have said big solid body candle (C much higher than open), that did not happen.
it is a tough day to trade low volume no econ news
We are in the POC zone. Hard to trade today...
RTH only
there is a potential H&S (to my eye, granted it is only potential) but today’s RTH = potential RIGHT shoulder, Yesterday = HEAD, 2 ago left shoulder
H&S is really just a complexe breakout pattern. Brooks has noted that most breakouts fail.
a failure for this potential H&S pattern would be a move more than 3 ticks above Friday's H of 1361.25
seems like 59-59.5 area is the magnet....was peak volume during rth yesterday, peak volume o/n and has the peak volume thus far...so unless some volume comes to the amrket to drive it away from that area it will continue to be a ping pong match...that said we are building value lower than yesterday, and those lows look very weak
below we have the 55 area that was peak volume from thurs and below that the 51.5 level, also from thurs rth...53.75 is the low vol that separates both areas
above we have 64 , and then a wider area that goes from 66ish to 69.5 and has yesterday's rth, the weekly s1 level, and the highs from the ovenight trade on sunday evening...the is some low vol in the 61.5ish area that separates the current 59 area and the 64 area mentioned earlier (last week's high also there)
NickP
your last paragraph, you mean weekly R1, right?
your last paragraph, you mean weekly R1, right?
yes paul, sorry, tried to edit it after i was done but the page would not let me...it is weekly r1
And to add to this S/R going forward, I've posted 2 charts for tomorrow here:
http://www.mypivots.com/board/topic/7277/1/es-thursday-2-23-1012
The first shows the PASR Zones/levels ... the second shows how those levels were derived. Like I've said, it's pretty simple.
http://www.mypivots.com/board/topic/7277/1/es-thursday-2-23-1012
The first shows the PASR Zones/levels ... the second shows how those levels were derived. Like I've said, it's pretty simple.
Emini Day Trading /
Daily Notes /
Forecast /
Economic Events /
Search /
Terms and Conditions /
Disclaimer /
Books /
Online Books /
Site Map /
Contact /
Privacy Policy /
Links /
About /
Day Trading Forum /
Investment Calculators /
Pivot Point Calculator /
Market Profile Generator /
Fibonacci Calculator /
Mailing List /
Advertise Here /
Articles /
Financial Terms /
Brokers /
Software /
Holidays /
Stock Split Calendar /
Mortgage Calculator /
Donate
Copyright © 2004-2023, MyPivots. All rights reserved.
Copyright © 2004-2023, MyPivots. All rights reserved.