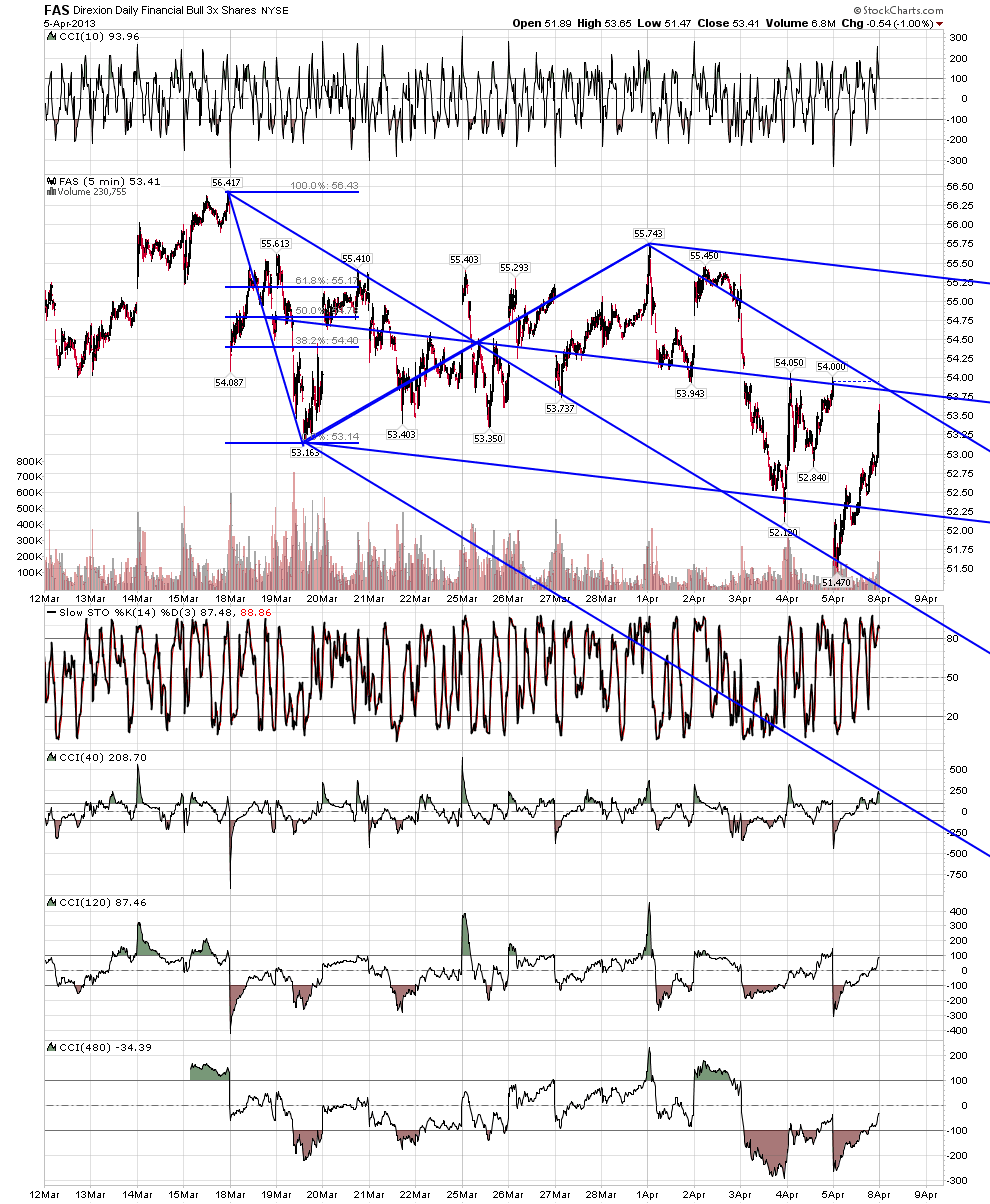
Here it is.
Chart.
Isn't Hindsight grand? Mine is 20/20 on this one. Looks almost like magic in hindsight, but it is just the tools, as presented in this forum.
Happy April Fools' Day.
Al Kamego
JI
jimkane
Rep: 3,058
Posts: 33,089
Thanks, roofer, I appreciate that.
Originally posted by roofer
fyi- my apologies... towards the end of the day i was just posting and trading and closing out positions preparing to blast out the door at 401 for the doctors.... i did not even see your question until a few minutes ago and responded promptly...best i can do.
JI
jimkane
Rep: 3,058
Posts: 33,089
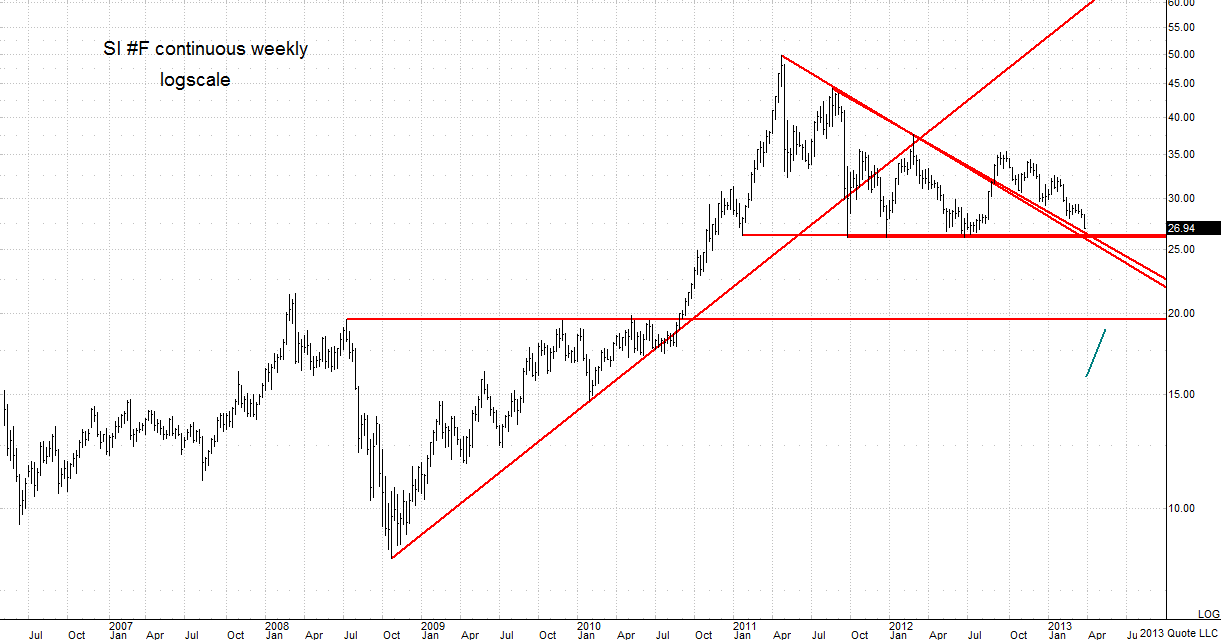
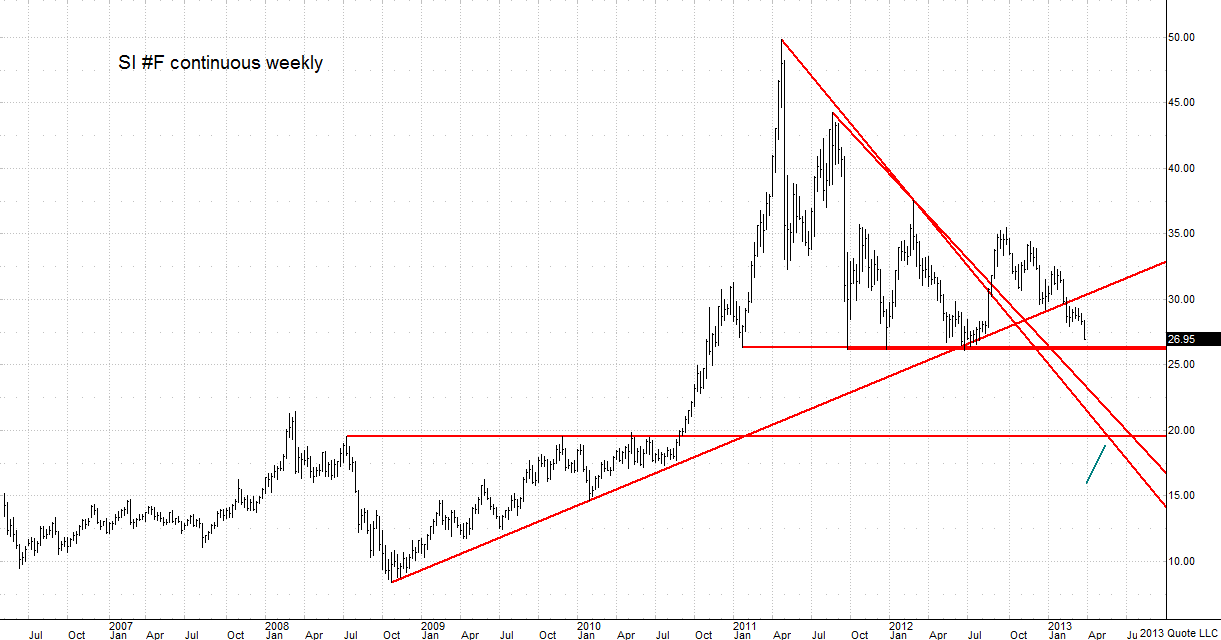
Does anyone recall the Silver continuous contract weekly chart I posted awhile back? Let's look at that again.
I've been dying to see silver get sub-20. This shows how, as the ES rises to those much higher levels I mentioned.
But, look what happens when we look at logscale, something that is relevant when the price scale is across such a large range.
Hmmm, maybe this is it, like many are saying. Either way, my areas are clear.
Charts created on QCharts, courtesy eSignal
JI
jimkane
Rep: 3,058
Posts: 33,089
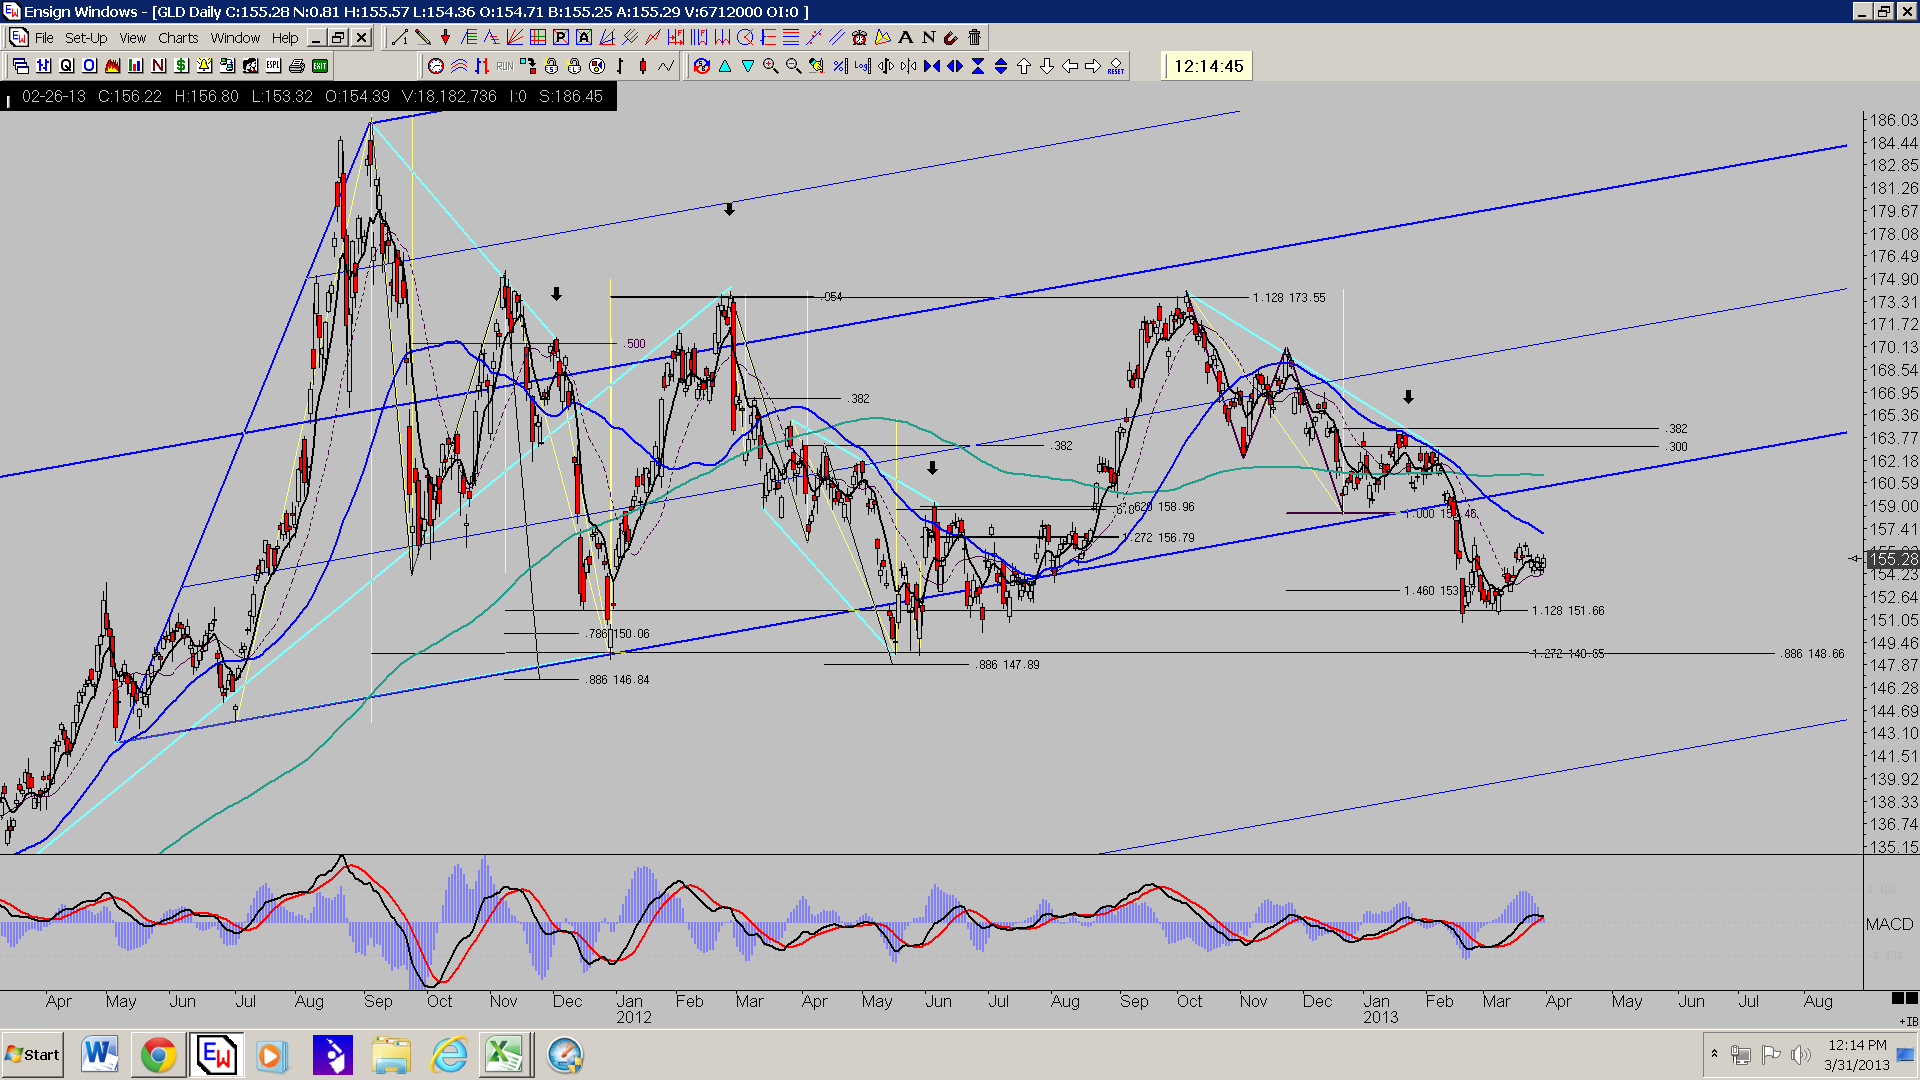
And remember (from the chart I posted back a ways), gold comes together at around 1350 if silver does make that move to the lower area. We all know what the ES would likely be doing if that does play out. Wow.
JI
jimkane
Rep: 3,058
Posts: 33,089
And gold has a lot of stuff between say 1445-70. That should be an issue for it, too. This is coming off the weekly chart.
JI
jimkane
Rep: 3,058
Posts: 33,089
My next area overhead for the ES, short-term, is 70-73, and if it really pops, 77. Assuming it goes up, which is not a given.