ES 5-1-13
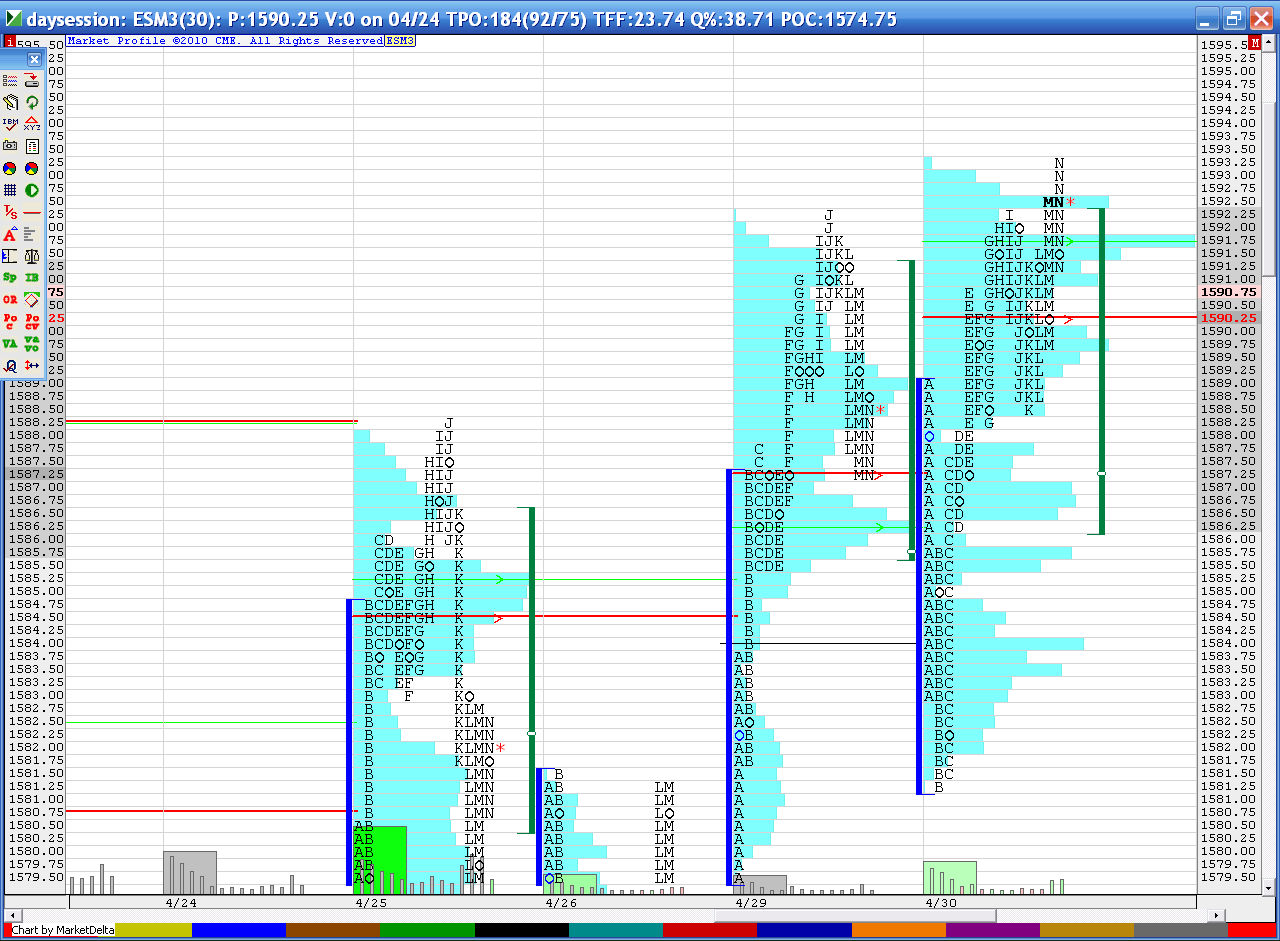
Good volume yesterday but most of it happened in the first half of the day. The second half just consolidated creating a nice bell curve with 93 at the upper end and 1588 ( last weeks high area ) for the low.
If you look on my chart you will see some nice swing lows at "G" and "K" period right into low volume at 1588. So still a critical spot today. Below there is another low volume spot that I thought would get tested yesterday but didn't at 85 and the VA low is at 86...
It all depends were we open today. I'm hoping we open inside yesterdays VA so we can try and sell above 93 ( VPOC of the O/N is 93.75 as I type) or buy at either 1588 or under 1586 closer to 85 if possible. In both cases I like the POC of 90.25 as a first target. Ideally we like to initiate trade 2.5 points below or above that price if possible.
R1 is at 97.25 today and s1 is at 84.25...reports today and fed announcement. All eyes are still watching that 93 high area to see if we can get a break out with good volume. So far big volume hasn't shown up yet
Click image for original size
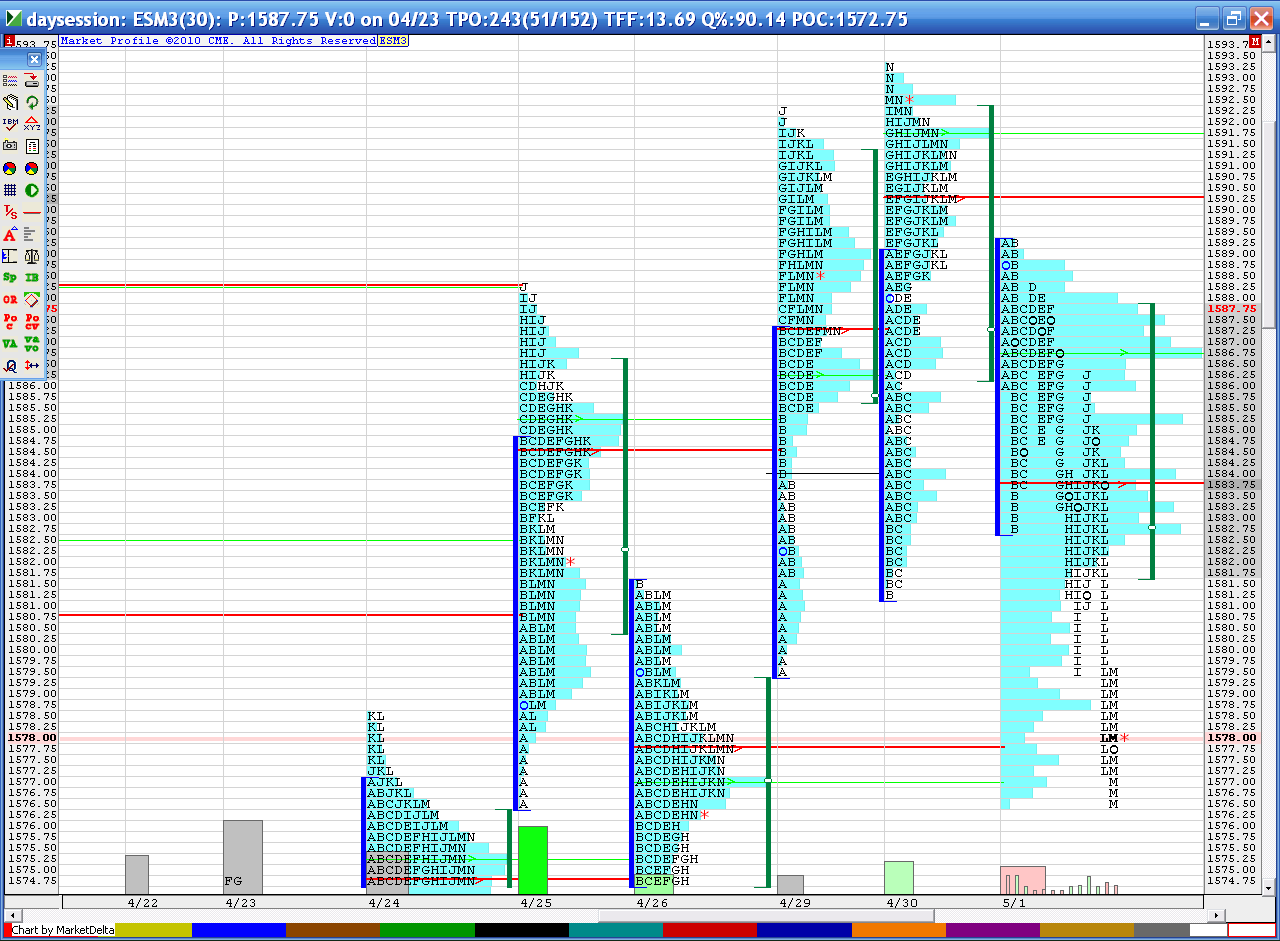
most days they tag a previous days POC...today none have been tagged and 90.25 and 77.50 are still open...certainly not suggesting to trade into reports but just thought I'd pass that along if anyone is trading in here
if they sell it off after the report I'd want to look for longs as close to the 73 - 74 area as possible..that is last months VPOC and the VA low from 4-26..otherwise I will still try to sell above the 93's
77 - 78 was the POC from last friday....I said at the start of Monday that it was a good probability that we would trade back to Fridays close since we opened inside the range of last week...but the bigger idea is that probabilities can be real difficult to trade for
That concept comes from our member paul here on the forum. So I stole it from him !!
Last weeks close was 76.25 for those trying to hang on down here !!
That concept comes from our member paul here on the forum. So I stole it from him !!
Last weeks close was 76.25 for those trying to hang on down here !!
one can really learn a lot about the markets if you realize that the market is always trying to figure out ranges and Value. So we always need to monitor both the Value areas and ranges of previous days.
Notice in today's "J" period high post report they stopped at yesterdays VA low. Note how "I" and "M" period used the VA highs from Friday..4/26 ...first as support then as resistance
I always ask myself "Can they hold above or below a VA line ? Can they hold above or below a range ?" The VA lines will give you better results but both are important
ok..enough rambling for today..there is the close gap filled and here is my chart for reference
Click image for original size
Emini Day Trading /
Daily Notes /
Forecast /
Economic Events /
Search /
Terms and Conditions /
Disclaimer /
Books /
Online Books /
Site Map /
Contact /
Privacy Policy /
Links /
About /
Day Trading Forum /
Investment Calculators /
Pivot Point Calculator /
Market Profile Generator /
Fibonacci Calculator /
Mailing List /
Advertise Here /
Articles /
Financial Terms /
Brokers /
Software /
Holidays /
Stock Split Calendar /
Mortgage Calculator /
Donate
Copyright © 2004-2023, MyPivots. All rights reserved.
Copyright © 2004-2023, MyPivots. All rights reserved.