JI
jimkane
Rep: 3,058
Posts: 33,089
Okay, I'll get it started for this week. I'm expecting another fantastic week, as far as action.
JI
jimkane
Rep: 3,058
Posts: 33,089
I feel very lucky today. I am reordering a food product from my usual online vendor. I last ordered three months ago. It's only up 15%. Last time I ordered, which was for vitamins, and it was six months, some were up 20%, some 30%, and some 50%. Nah, inflation is running at 1% or 2%. The Fed and the gov tell me so, and I know they wouldn't lie to me. After all, they exist only to serve my interests, right? So, my food item here shouldn't be going up for another fifteen years now, with that last increase, I'm paid up for increases for awhile now.
As an aside, a 15% increase every three months is about a 75% increase per year. For those not math inclined, that's about a 43% loss of buying power of your retirement savings in a year. Nah, there's no inflation. Wait, I need to check the product size, maybe that went down, too.
As an aside, a 15% increase every three months is about a 75% increase per year. For those not math inclined, that's about a 43% loss of buying power of your retirement savings in a year. Nah, there's no inflation. Wait, I need to check the product size, maybe that went down, too.
JI
jimkane
Rep: 3,058
Posts: 33,089
I guess this all bothers me more than it does even most of the people in here. Must be normalcy bias, even for such knowledgeable people as we have in here.
http://www.zerohedge.com/news/2013-07-30/marc-faber-central-banker-actions-insane-people-dont-realize-theyre-insane
http://www.zerohedge.com/news/2013-07-30/marc-faber-central-banker-actions-insane-people-dont-realize-theyre-insane
RO
roofer
Rep: 3,689
Posts: 3,574
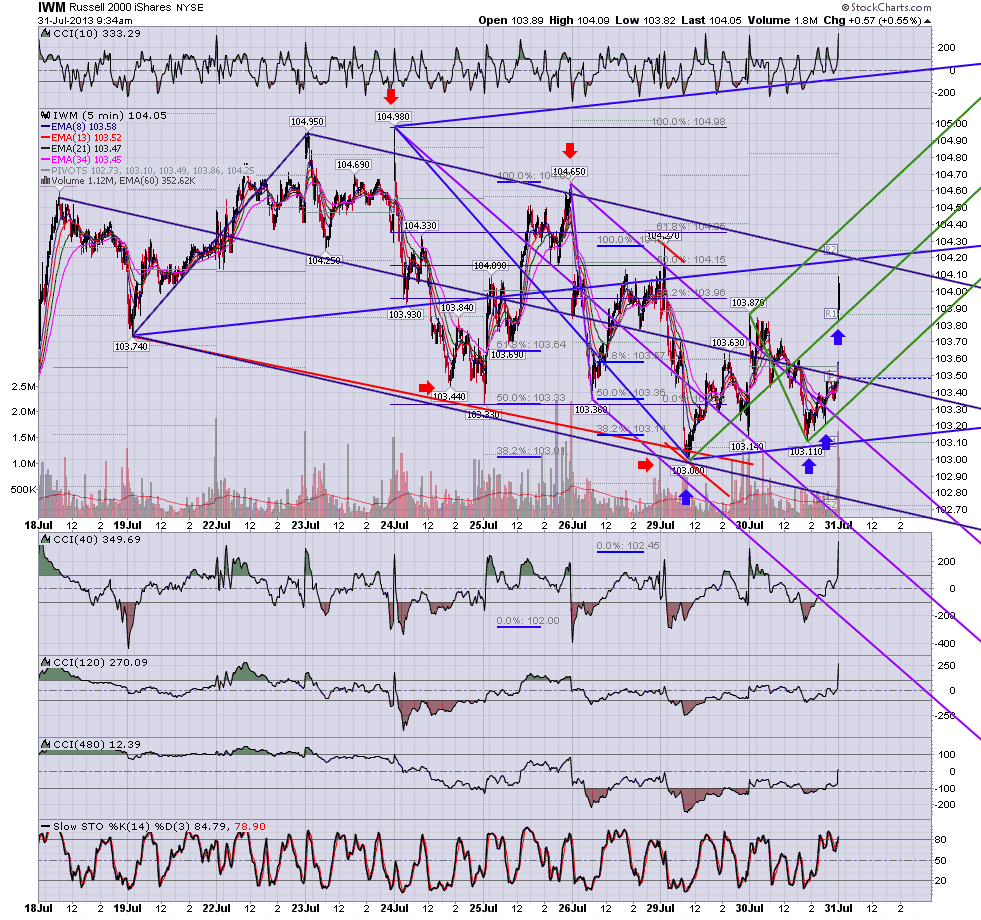
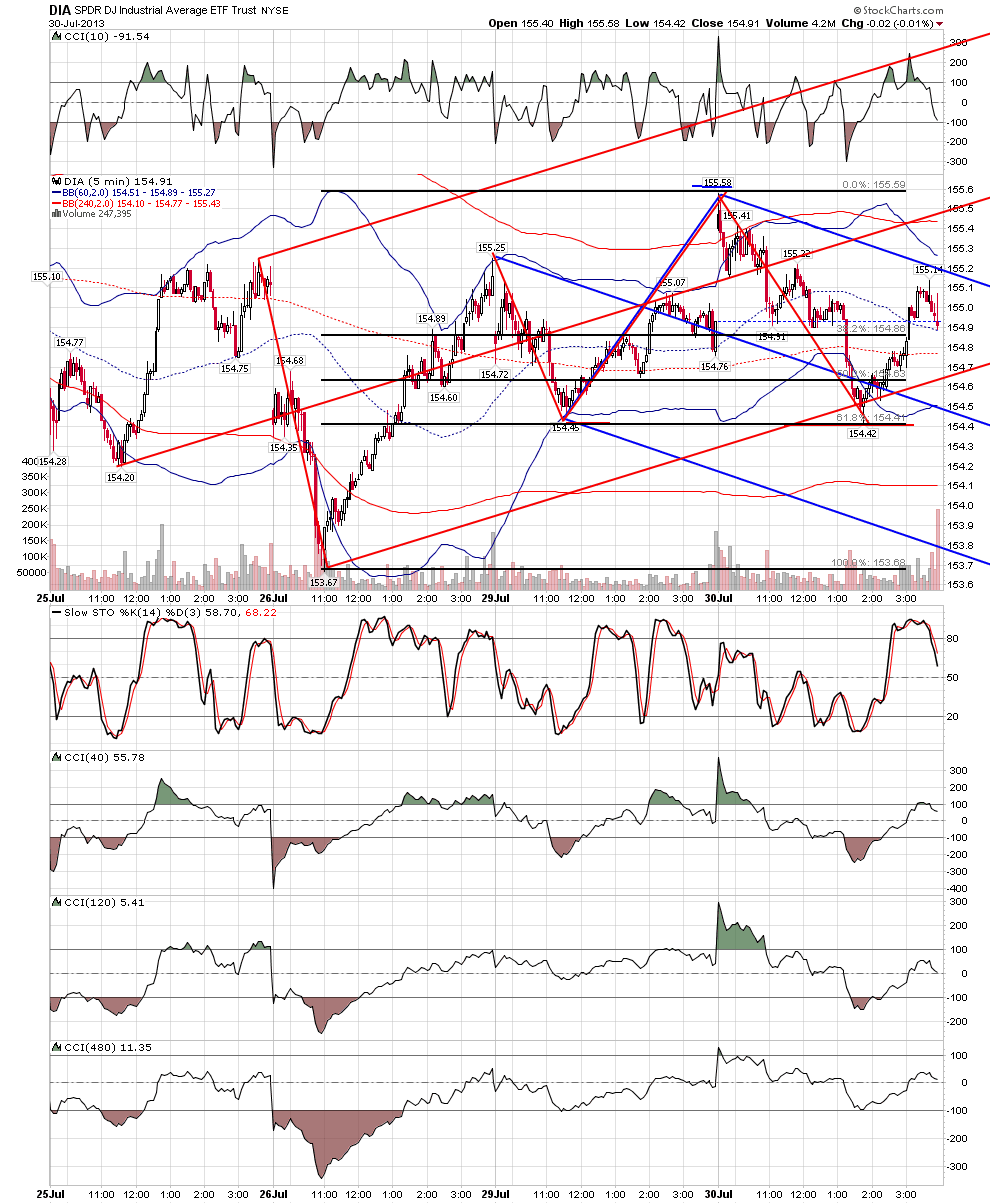
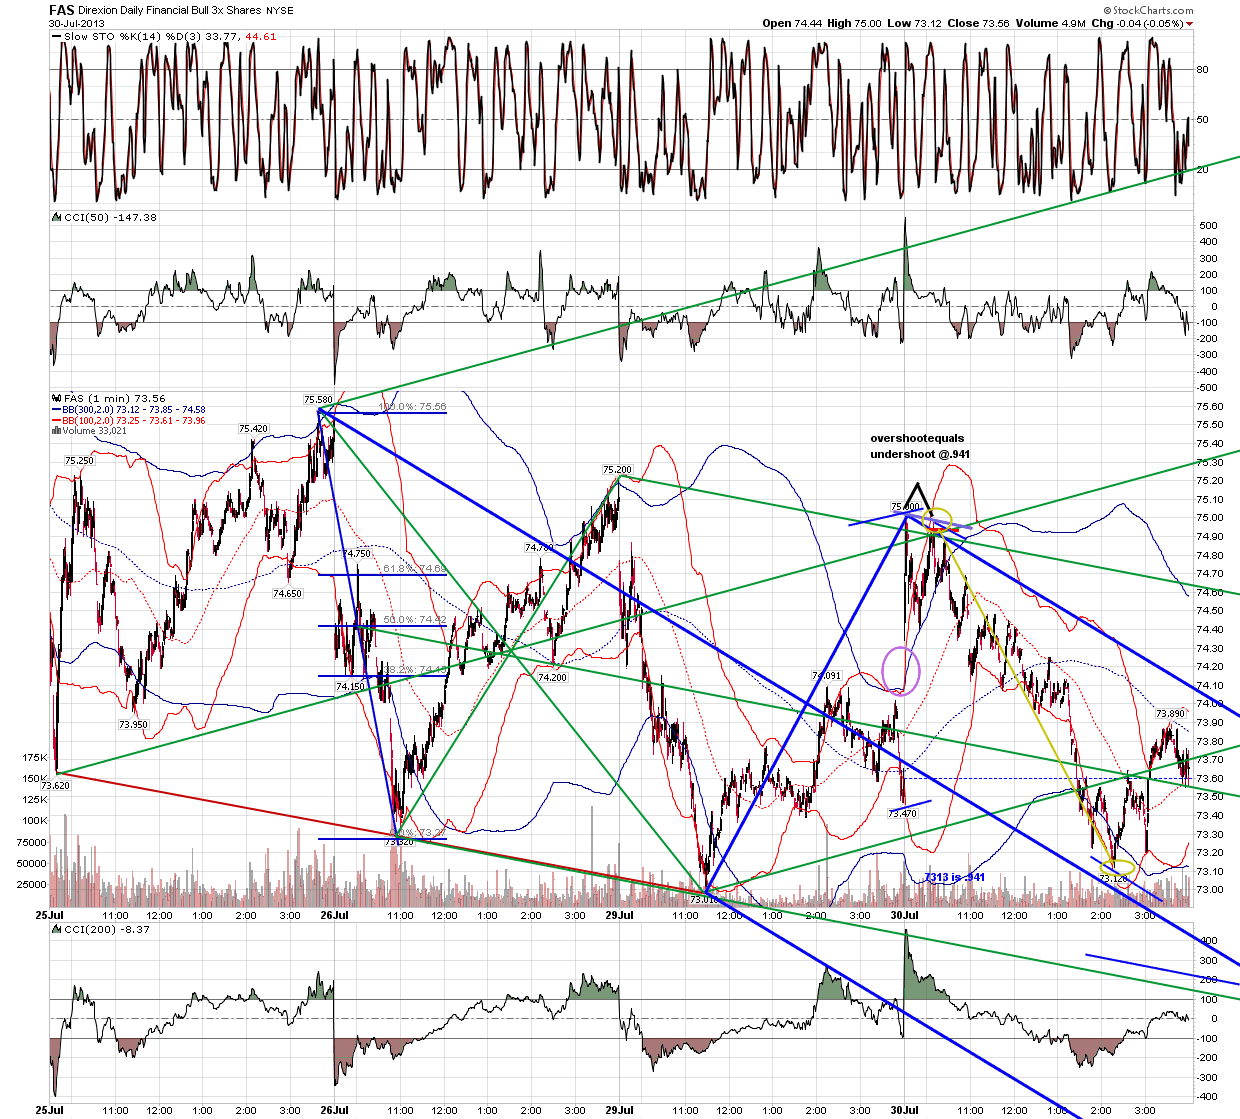
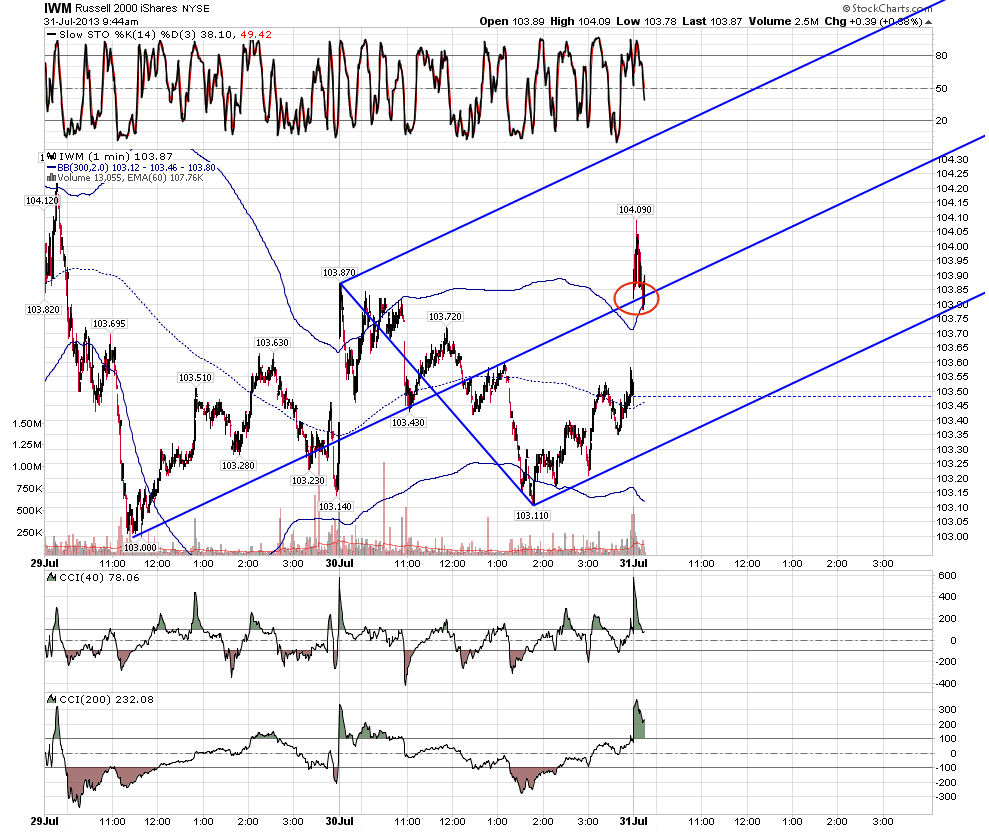
i thought traders would like to see what was happening based on geometry in other indexes.. both the previously shown TNA and the FAS offered sell signals in the morning and as jim was calling for a turn later in day based on his futures work the FAS and DIA traded to key revesal levels.. note particularly the DIA.. if the morning high had been 3 cents higher it would have been the 1.46 exact... then the afternoon low @.618 would have completed double bottom abcd at exact same price...instead of 3 cents lower... and so it goes... i am sure you all saw this but i just thought i would make it part of the record
Click image for original size
Click image for original size
JI
jimkane
Rep: 3,058
Posts: 33,089
And the 86 area is hit. Wow, what a shocker.
Here's my usual look:
Here's my surprised look:
Here's my usual look:
Here's my surprised look:
JI
jimkane
Rep: 3,058
Posts: 33,089
I'm really looking at 97.50 area next, but 92.75 has me watching there 'on the way up'. I want to see how it acts when it gets all the immediate stops overhead, as it may not quite make it to 92.75 in the stop run. Then they may bring it down a bit to make it five days in a row with the down then lift-a-thon ramp. This would work well with the Fed announcement tomorrow. Or, just run it up until then and then bring it in on the 'news'? I have to see how it shapes up to form the plan at that time. For now, it's a 'management mode' scenario, just seeing what it does.
JI
jimkane
Rep: 3,058
Posts: 33,089
Here's what my commentary looked like approximated on the chart as to when I said it. Look at the posts before, and after. Look at the levels I mentioned. Try to figure out how I got these reads. Not an unusual day in the KT forum, day in and day out...
Chart created on QCharts, courtesy eSignal
Click image for original size
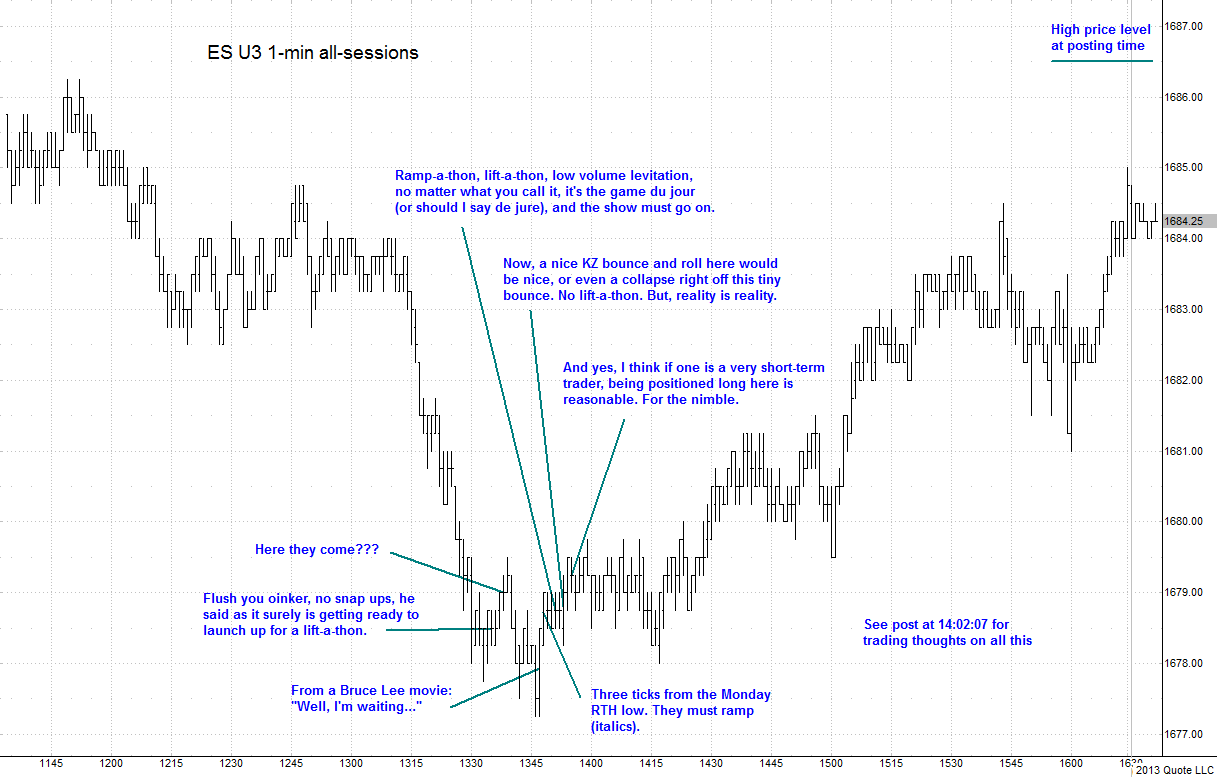
Chart created on QCharts, courtesy eSignal
RA
rat89
Rep: 0
Posts: 7,015
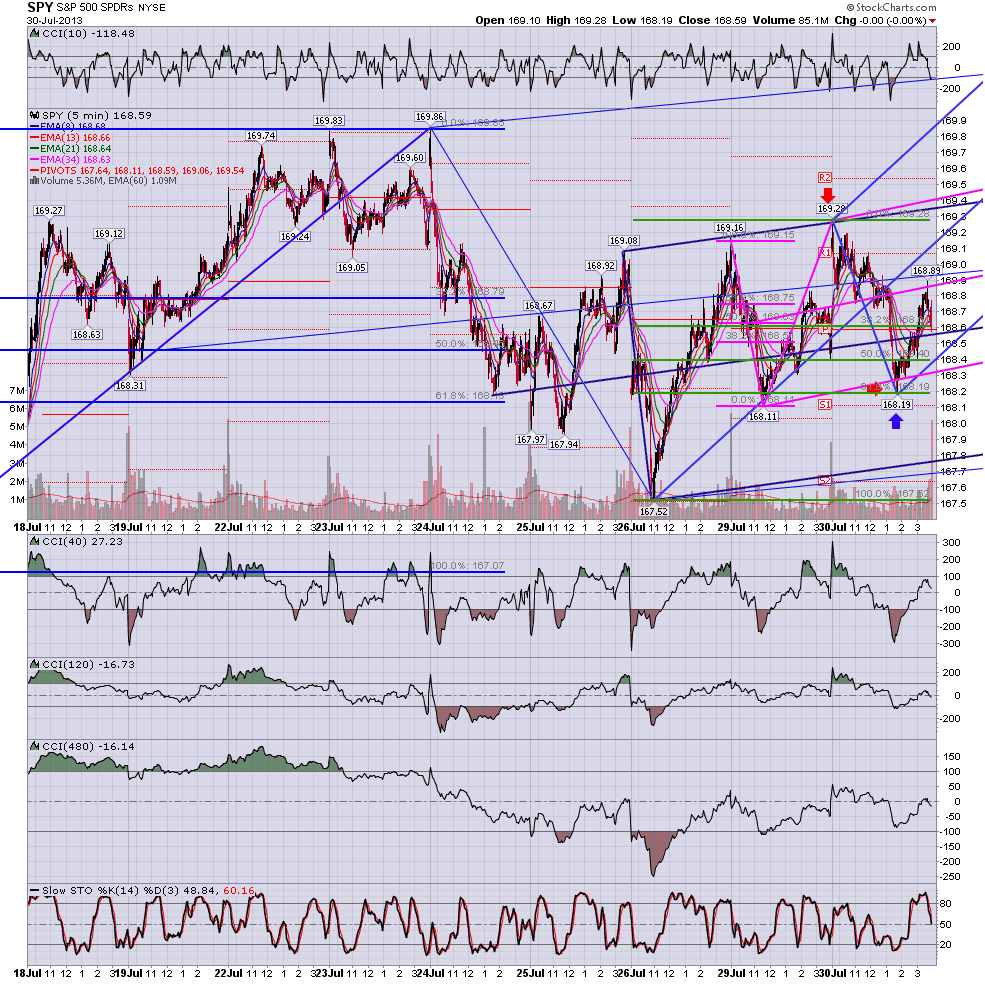
magenta bear set took price line to line to land at .942 of 168.11 upswing, .618 of BOTH swings up from 167.07 and 167.52....unless this completely breaks down, I read it as an overwhelmingly bullish abcd continuation setup
Click image for original size
RA
rat89
Rep: 0
Posts: 7,015
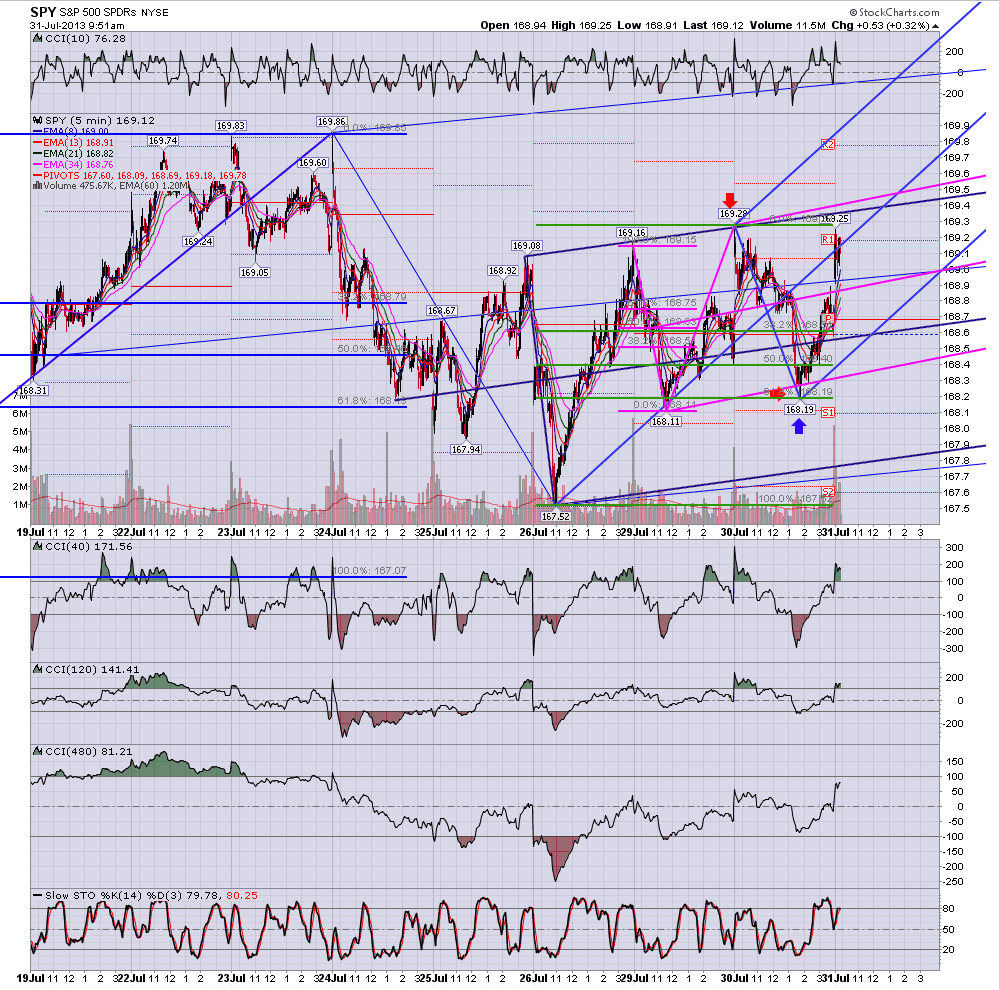
first target hit
Click image for original size
Click image for original size
Click image for original size