ES Thurs 11-14-13
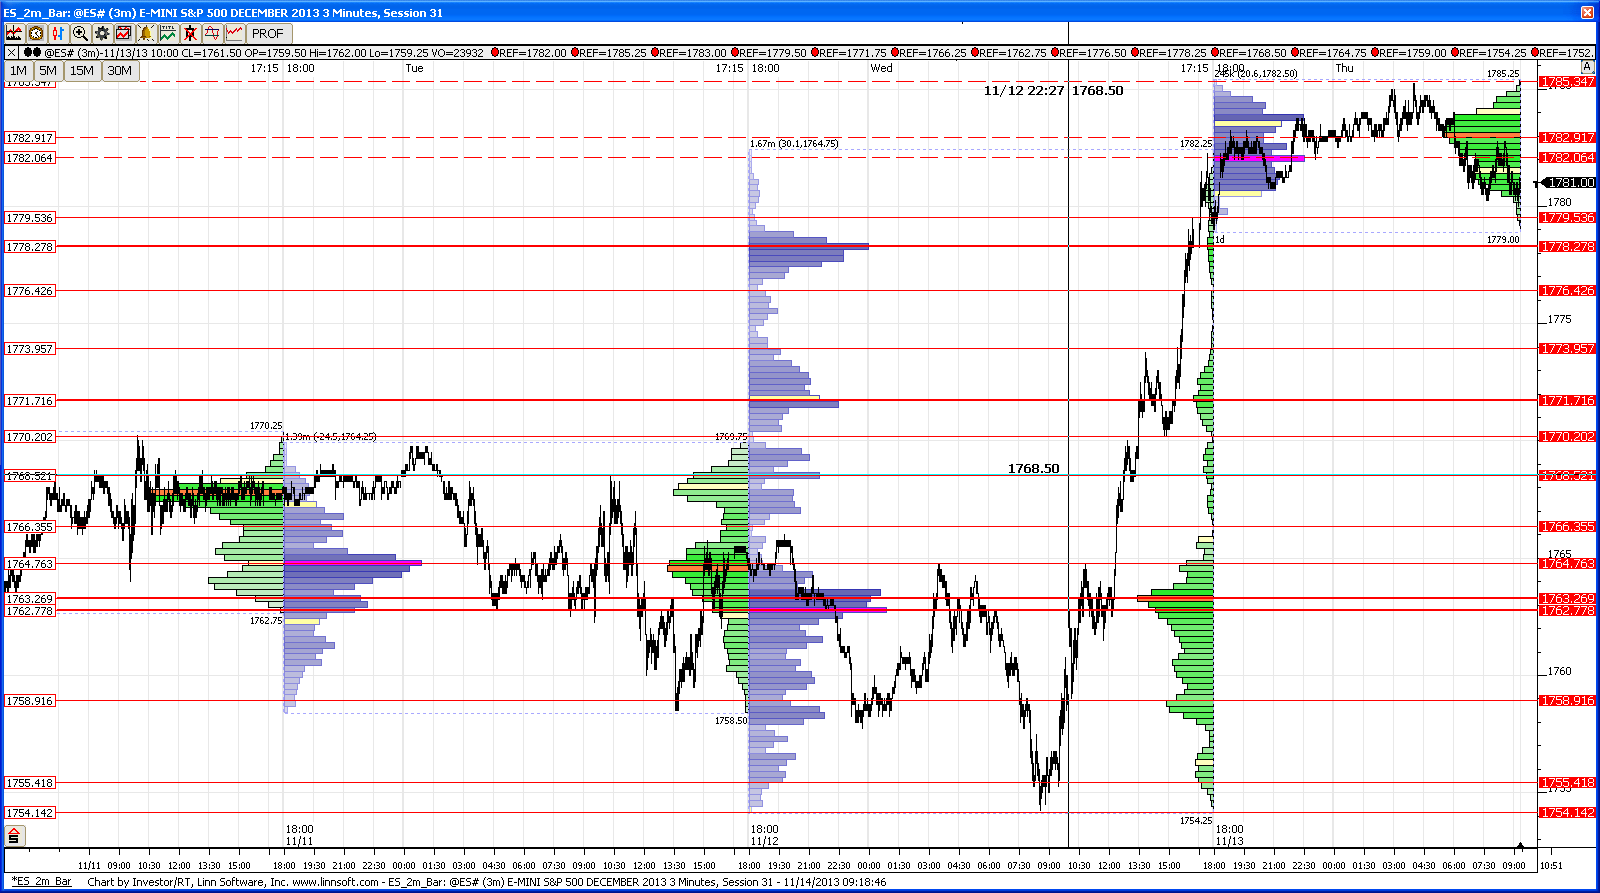
Here's what i have...only one chart with all session data (dotted lines are based on o/n action)...
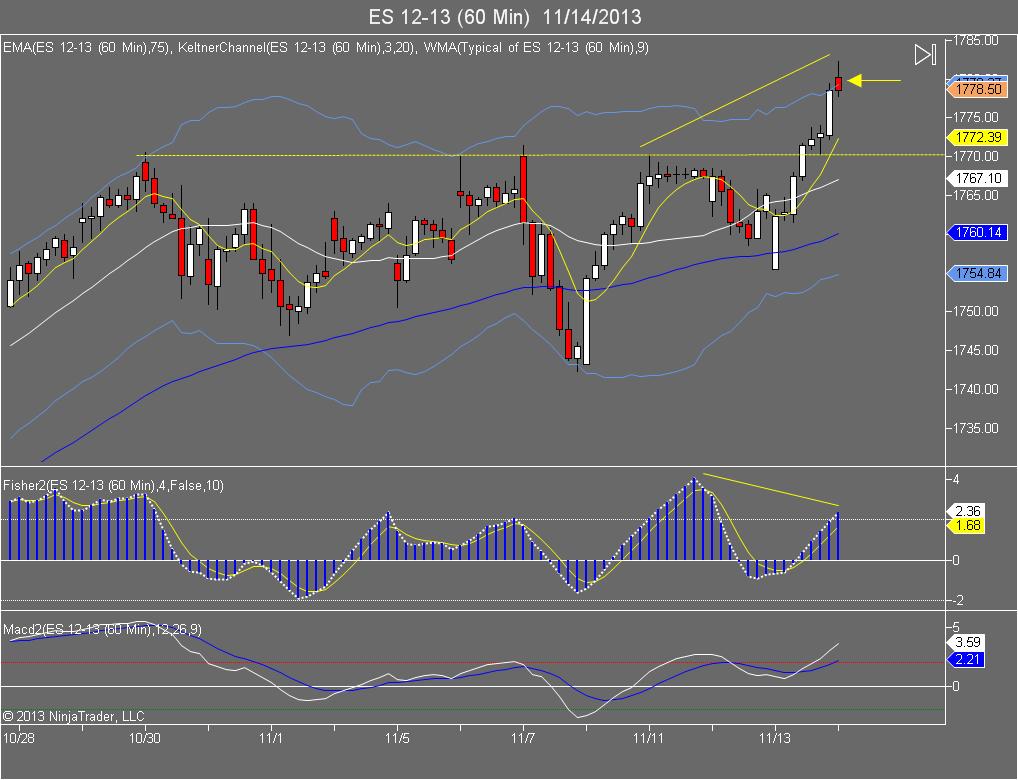
pretty clear curves and zones to work from below
i have daily and weekly pivots in the 87-89 areaa and then up at 95 and 99-00...but remember there is no hard resist above current highs
good luck
pretty clear curves and zones to work from below
i have daily and weekly pivots in the 87-89 areaa and then up at 95 and 99-00...but remember there is no hard resist above current highs
good luck
Click image for original size
Click image for original size
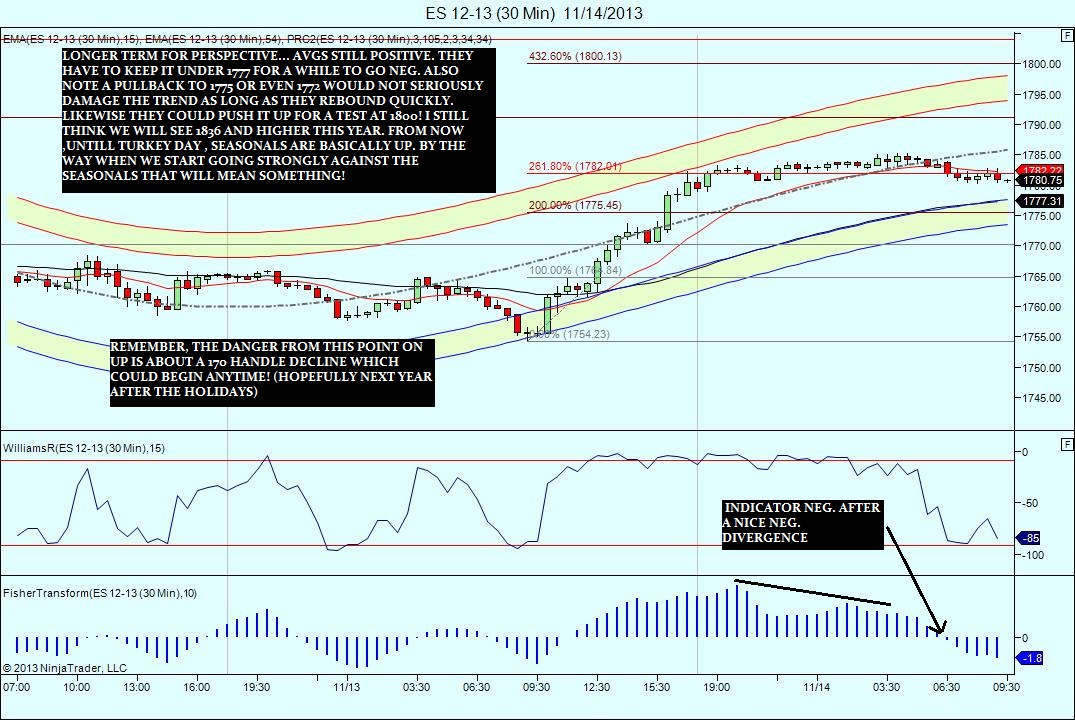
Im just starting to look at the short term but heres a peak
Click image for original size
still expecting 1775
see if you consider the initial move to be drawn to this low, that 1775 still comes into play.
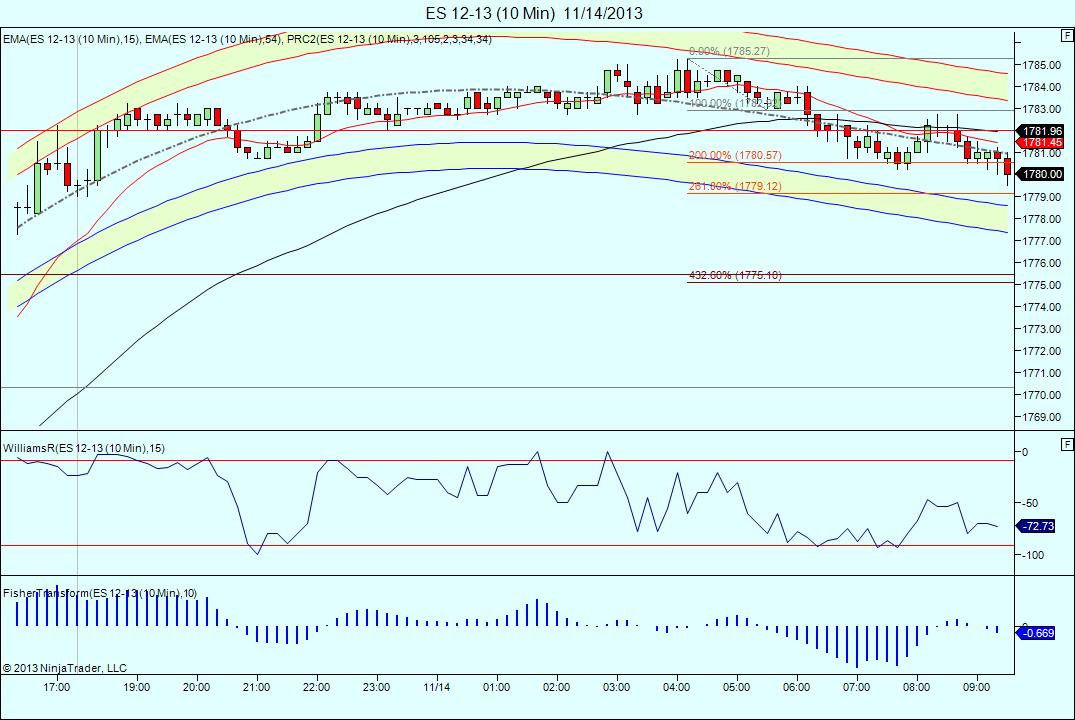
Click image for original size
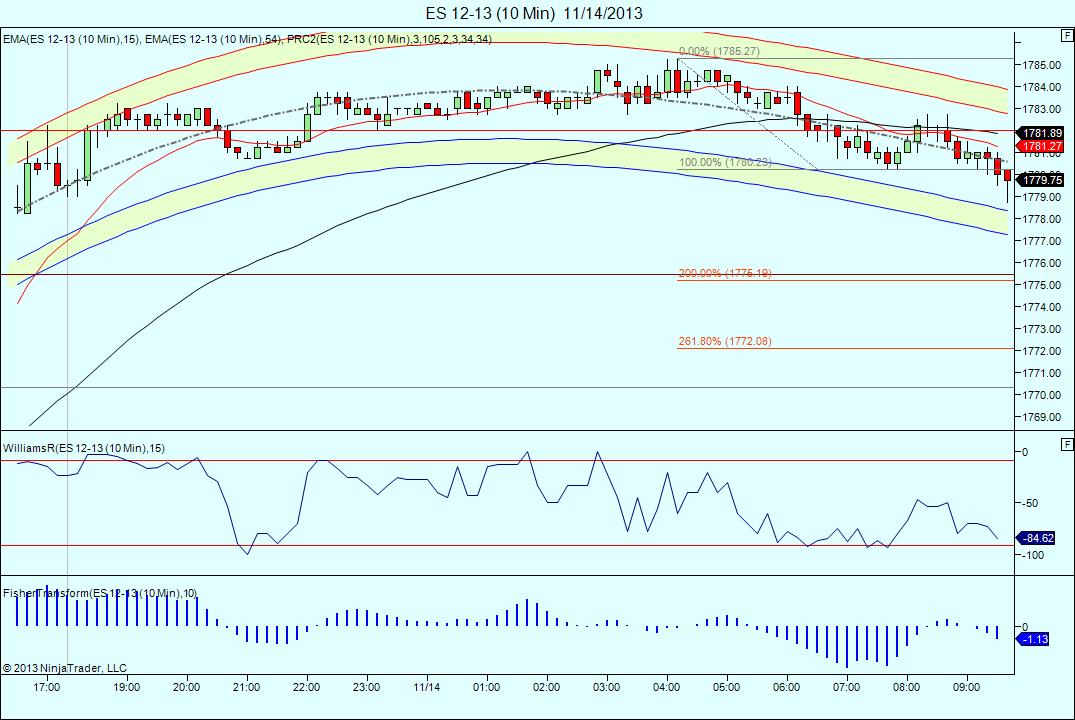
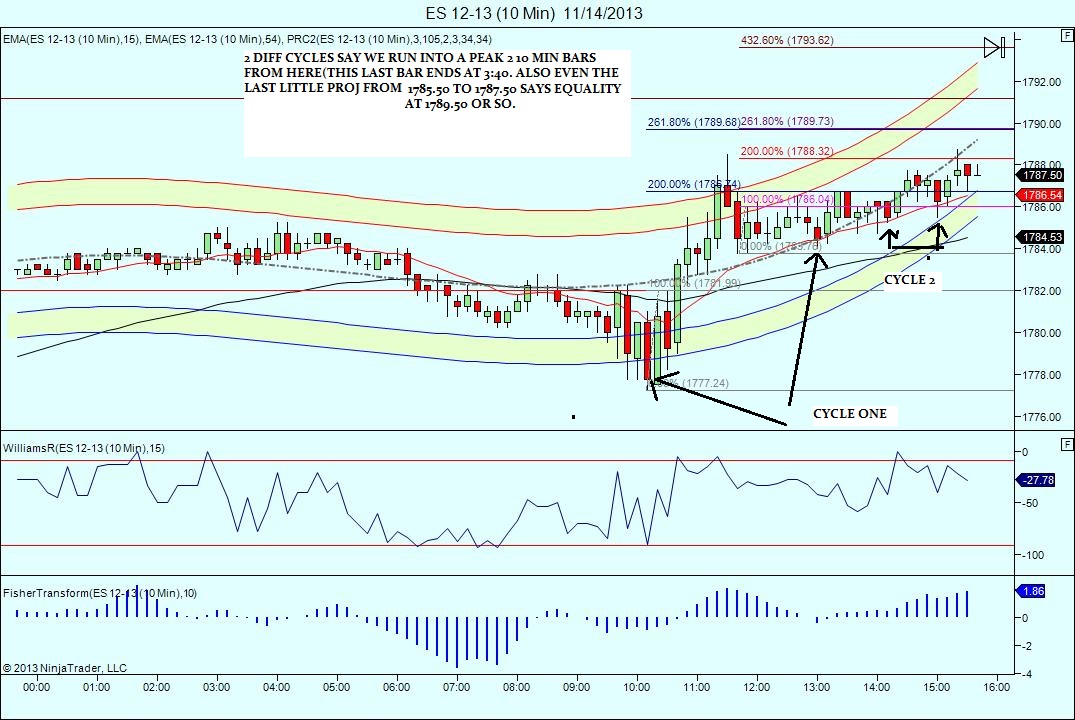
note on the 10 min the avgs are neg! That lends credence to my feeling we will see 1775 at a minimum.. But who knows?
MAN on the 5 min chart the chart had a nice candle for projection 78.75 to 80.75 so i tied to sell equality at 1782.75 (my order was 1782.50). that could have been the short of the day!..sheeese
I like the looks of this opening candle at the 60 minute keltner...
Click image for original size
On Nick's chart it looks like some single prints down there around the 74 level.
well i took ashort up here ..hope it pays off. Yellen is speaking,thats what this wild run up is about.
covering half at 79.00 and hoping for 76.00 for the runner.
stopped my runner out but i still took 2 handles off em
Click image for original size
Emini Day Trading /
Daily Notes /
Forecast /
Economic Events /
Search /
Terms and Conditions /
Disclaimer /
Books /
Online Books /
Site Map /
Contact /
Privacy Policy /
Links /
About /
Day Trading Forum /
Investment Calculators /
Pivot Point Calculator /
Market Profile Generator /
Fibonacci Calculator /
Mailing List /
Advertise Here /
Articles /
Financial Terms /
Brokers /
Software /
Holidays /
Stock Split Calendar /
Mortgage Calculator /
Donate
Copyright © 2004-2023, MyPivots. All rights reserved.
Copyright © 2004-2023, MyPivots. All rights reserved.