ES Monday 2-24-14
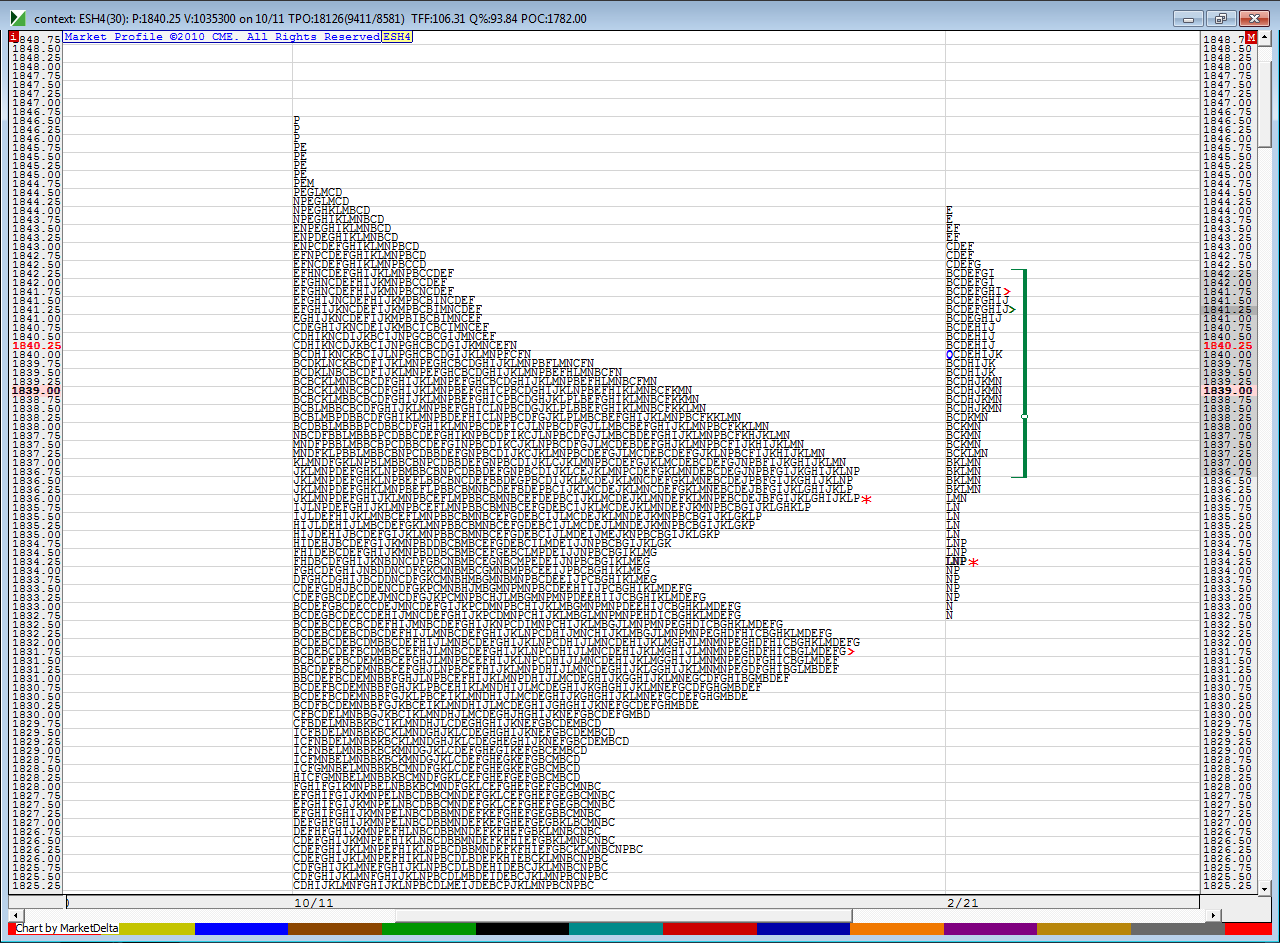
Much of this may be useless by the time we open as we have seen moves happening a bit past 9 a.m but here is context chart...this is Friday's trade against the bigger picture...note how the VA low goes well with a big hump in prices from the composite
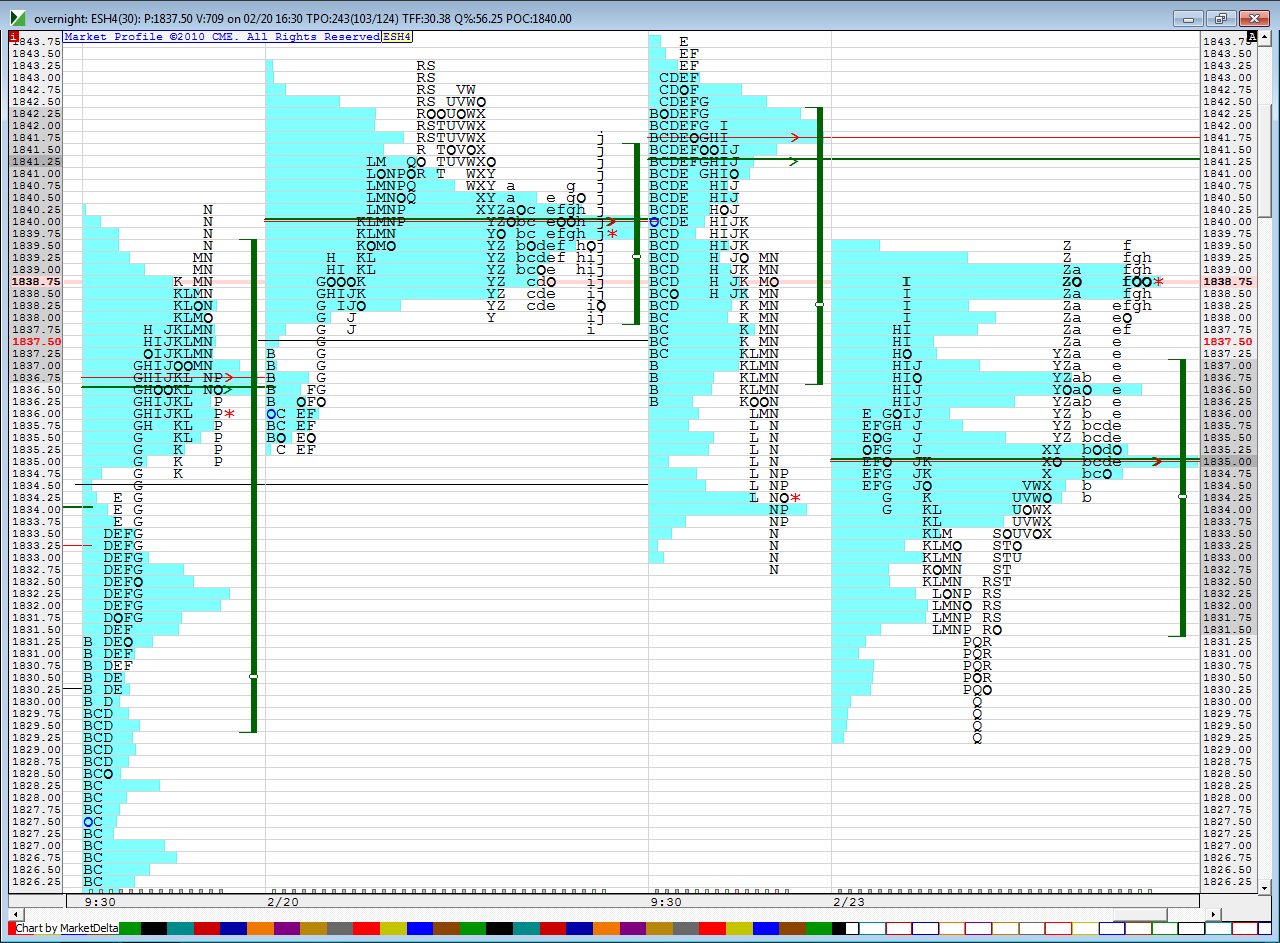
next we have what has happened in the overnight....we had a selloff at the after noon pull back high but have come back to it as I type...on this chart when you see "9:30" it is a day session and when u see the date it is the overnight...note also how the current O/N low stopped at VA low from a few days back at the 29 area...an important reference for the future..note also how the On POC and VPOC formed at a LVN spot from friday ("P" period highs).....so if we open in Value today we may need to use two different buy spots...the VA low from Friday but also the 1835 number ..so I'm making 35 - 36.50 a zone to look at whenever we get back to that
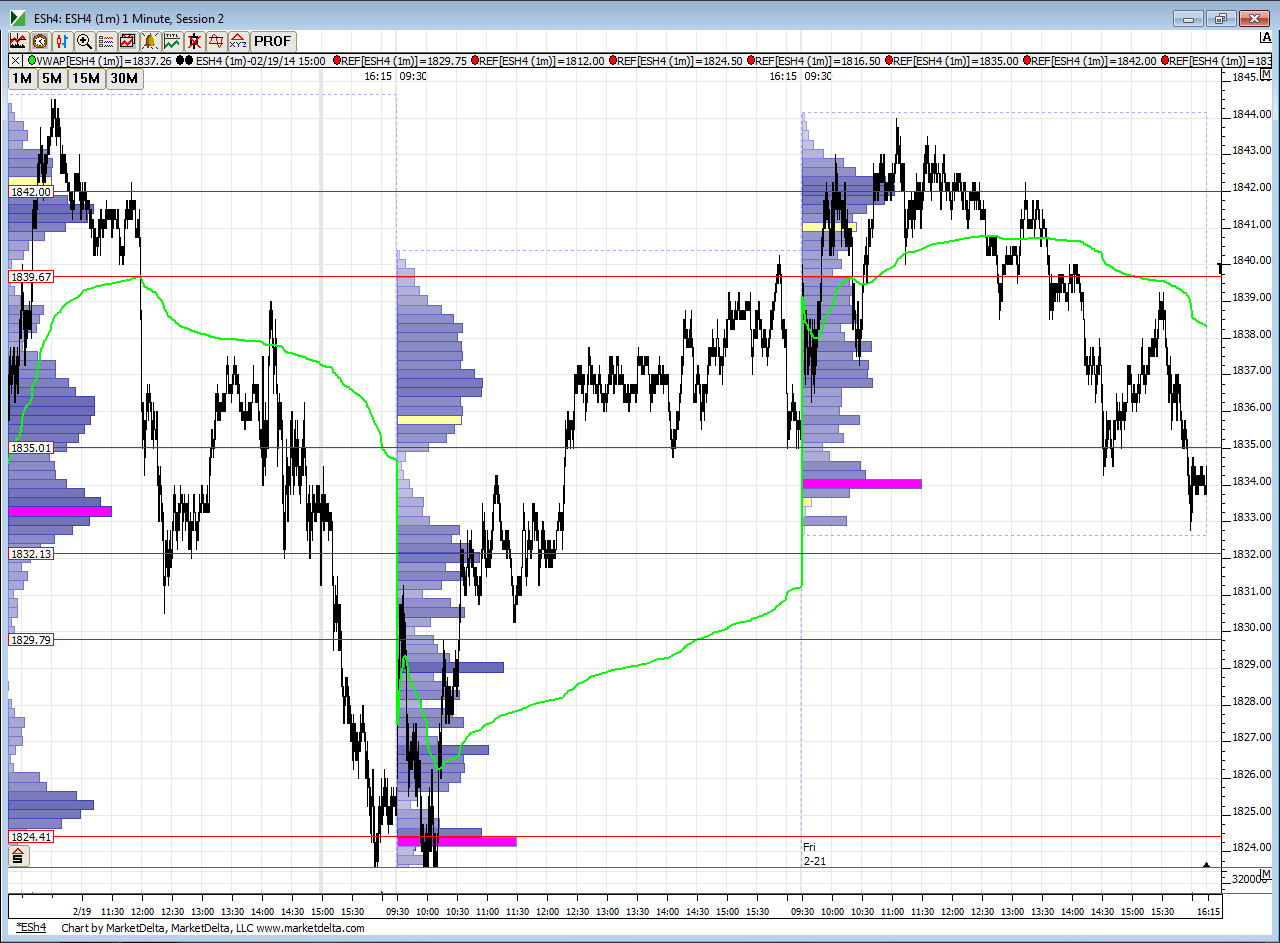
and here is a day session Volume profile...note that 32.13 from a bell curve from Thursday...that goes well with another hump from our CONTEXT chart....so if we open above we not only have the 35 - 36.50 zone but under Fridays lows we bump up into that 32....then the 29 below there ..above is that 42 and then we might as well just wait till we see if they can push new contract highs above...so watch 46 - 47 closely if they push there today ....many short traders would be trapped from longer term shorts but also those who thought they caught a good short trade and have stop outs above Fridays highs.....all that short covering could lead to a trend...just something to be careful of
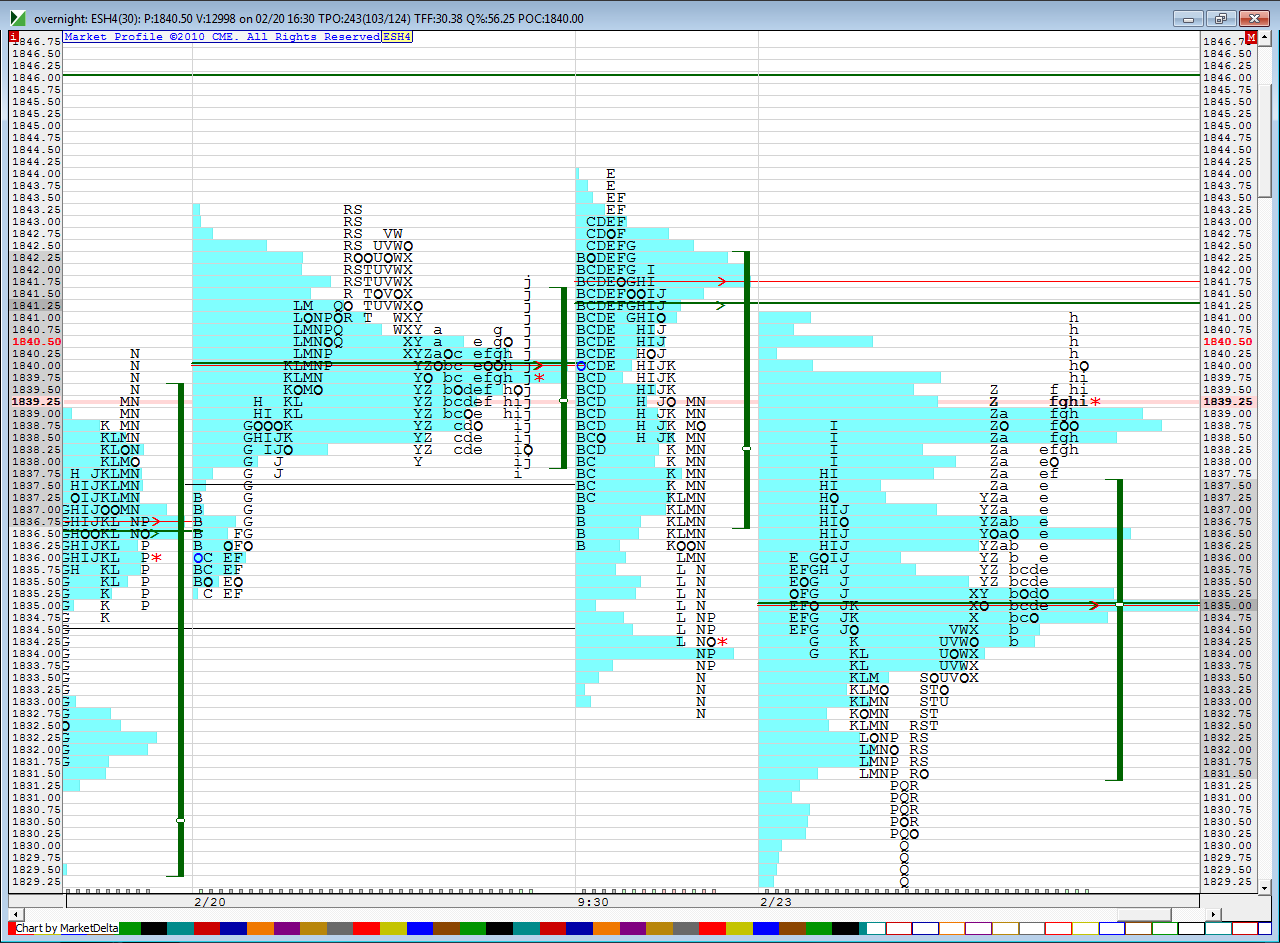
quick update...here is a new O/N chart... as I was making this we rallied higher to the 41- 42 area....it seems the real key to getting this right today is going to be that afternoon pull back high and LVn at 39..
Click image for original size
next we have what has happened in the overnight....we had a selloff at the after noon pull back high but have come back to it as I type...on this chart when you see "9:30" it is a day session and when u see the date it is the overnight...note also how the current O/N low stopped at VA low from a few days back at the 29 area...an important reference for the future..note also how the On POC and VPOC formed at a LVN spot from friday ("P" period highs).....so if we open in Value today we may need to use two different buy spots...the VA low from Friday but also the 1835 number ..so I'm making 35 - 36.50 a zone to look at whenever we get back to that
Click image for original size
and here is a day session Volume profile...note that 32.13 from a bell curve from Thursday...that goes well with another hump from our CONTEXT chart....so if we open above we not only have the 35 - 36.50 zone but under Fridays lows we bump up into that 32....then the 29 below there ..above is that 42 and then we might as well just wait till we see if they can push new contract highs above...so watch 46 - 47 closely if they push there today ....many short traders would be trapped from longer term shorts but also those who thought they caught a good short trade and have stop outs above Fridays highs.....all that short covering could lead to a trend...just something to be careful of
Click image for original size
quick update...here is a new O/N chart... as I was making this we rallied higher to the 41- 42 area....it seems the real key to getting this right today is going to be that afternoon pull back high and LVn at 39..
Click image for original size
Flat at 5200, got the VPOC shift and no upward reaction, still have divergences I think that retest is in order
Still has that short covering look to it. I think that 46 area will still come into play if we go back there. Sorry my flat was at 5100, wishful thinking I guess.
a great concept but i couldn't find an entry and too little profit potential...all that would be left for me was to trade for a previous bracket low retest but that is the OLD me talking...the NEW me doesn't stay and play much past 11 a.m.. good luck if ya stay and nice trade bkay...that 45 - 46.50 is on my radar for the future.....usually gaps like that in the data don't stay very long......in my memory it's at best two trading days before they fill in...so my plan would be to start looking once we get near 49.........prbably won't happen in my prefferred time zone but will give me something to think about;
anyone who flipped that vpoc would not want this above 55...so if taking shorts off 90 minute high or for previous bracket test then that's what I would use as an uncle point
Thanks Bruce, I'm not big on anything between 11:00 and 1:00 either. Time to work out. I'll be back later if anyone is around.
See ya guys. Congrats to both on nice trades.
Nice trading to everyone, as well...
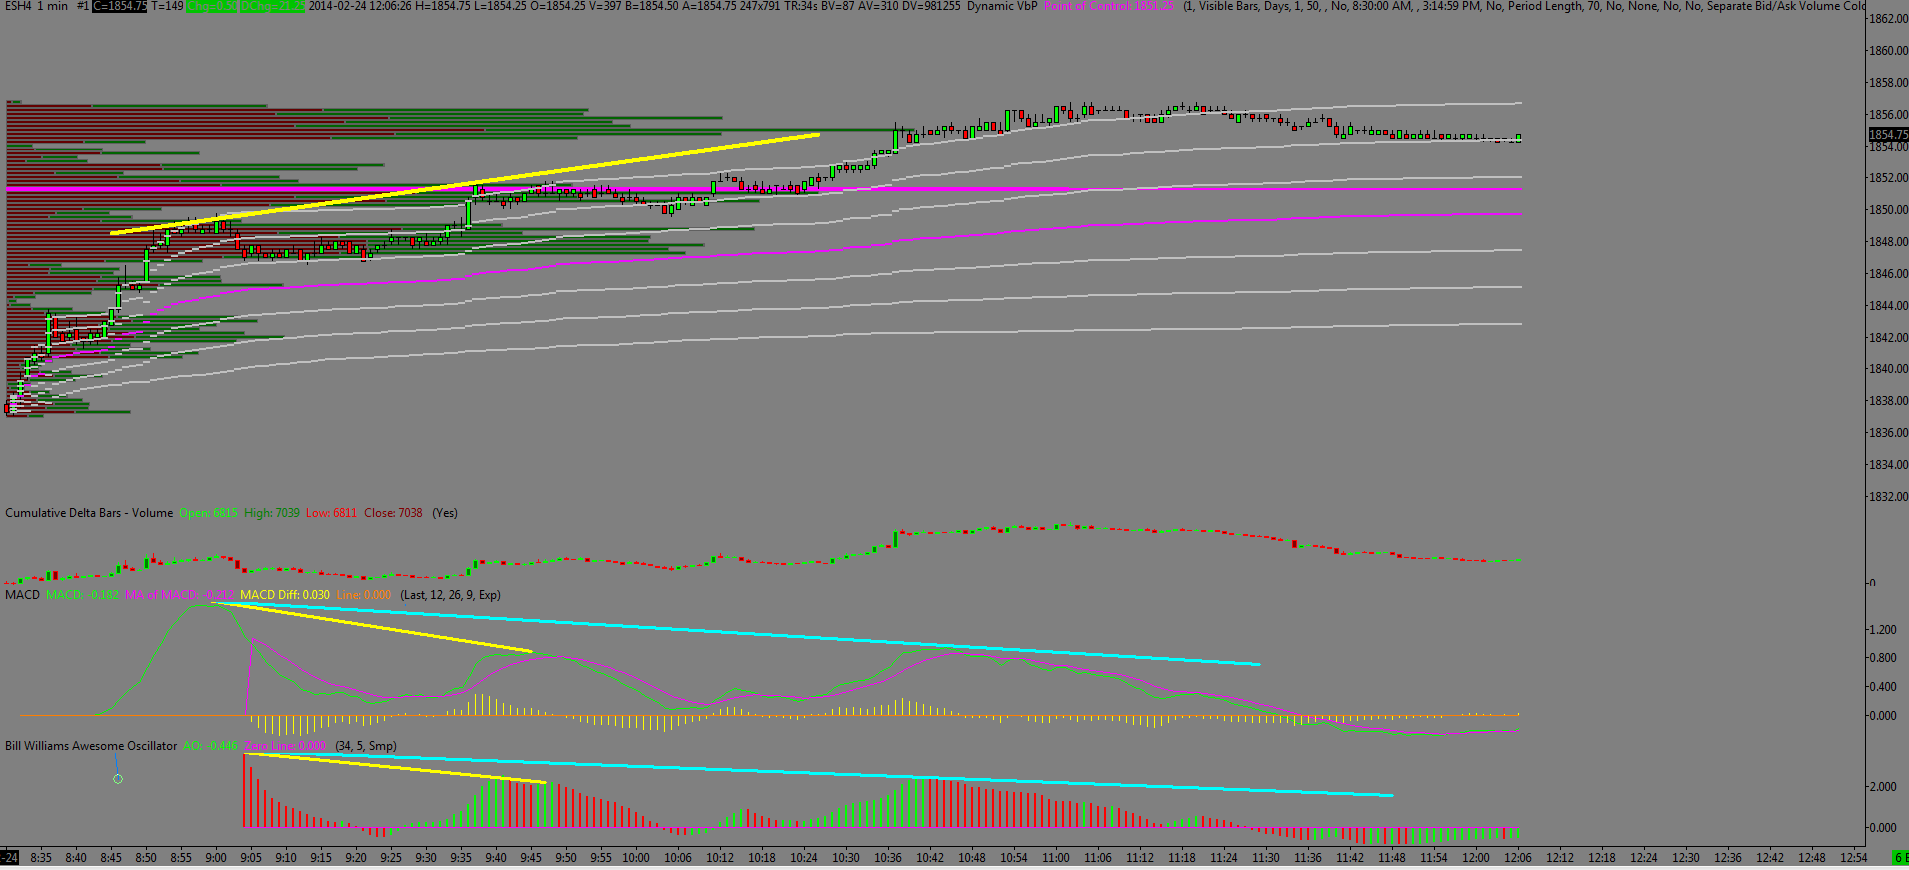
Here's a snapshot of what I was looking at earlier today when I referenced divergence.
1 minute chart showing the move up at the start of the day. The top graph in the lower section shows the CD which in this case coincided with the move. The next graph is the MACD yellow line showing the divergence into the area where I exited. the blue line showing continued divergence as the market continues up.Likewise the lower graph showing the Williams Oscillator with the same basic view.So as we continue to new highs these indicators do not support that.Where will we go? Dunno, the indicators took me out of a trade (runners) that still had room to run. But that's OK by me as it's all part of the steep learning curve.
Click image for original size
1 minute chart showing the move up at the start of the day. The top graph in the lower section shows the CD which in this case coincided with the move. The next graph is the MACD yellow line showing the divergence into the area where I exited. the blue line showing continued divergence as the market continues up.Likewise the lower graph showing the Williams Oscillator with the same basic view.So as we continue to new highs these indicators do not support that.Where will we go? Dunno, the indicators took me out of a trade (runners) that still had room to run. But that's OK by me as it's all part of the steep learning curve.
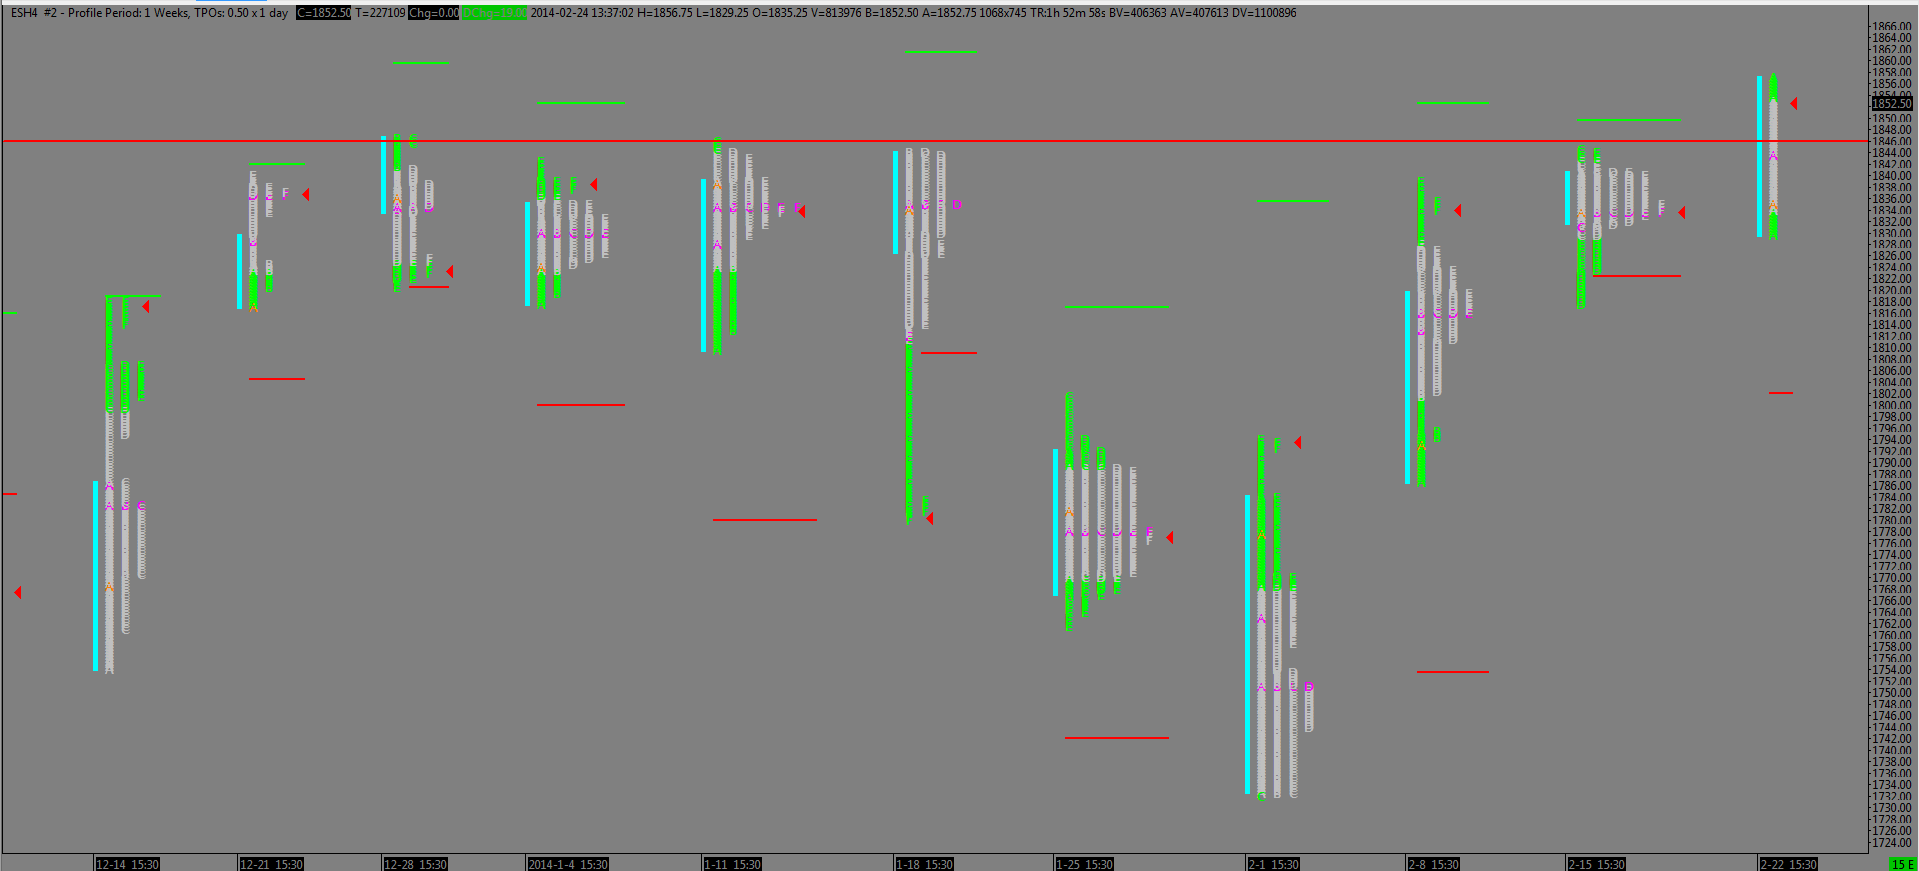
Here's why I'm looking at that 4600 area. Weekly profiles going back to mid December. Red line at 4600.
Click image for original size
From a very basic viewpoint we have a ledge at 5250, A single at 5200, also the lowest volume of the day above the 4650, and a market that's way long. An obvious short is a break of the ledge, possibly too obvious as stops abound down there. However if she doesn't get back above 5500 it may be worth a stab to try to get 5200.
OK I'm flat again at 4925. That's it for me Hopefully will see you tomorrow.
Emini Day Trading /
Daily Notes /
Forecast /
Economic Events /
Search /
Terms and Conditions /
Disclaimer /
Books /
Online Books /
Site Map /
Contact /
Privacy Policy /
Links /
About /
Day Trading Forum /
Investment Calculators /
Pivot Point Calculator /
Market Profile Generator /
Fibonacci Calculator /
Mailing List /
Advertise Here /
Articles /
Financial Terms /
Brokers /
Software /
Holidays /
Stock Split Calendar /
Mortgage Calculator /
Donate
Copyright © 2004-2023, MyPivots. All rights reserved.
Copyright © 2004-2023, MyPivots. All rights reserved.