ES Friday July 11 2014
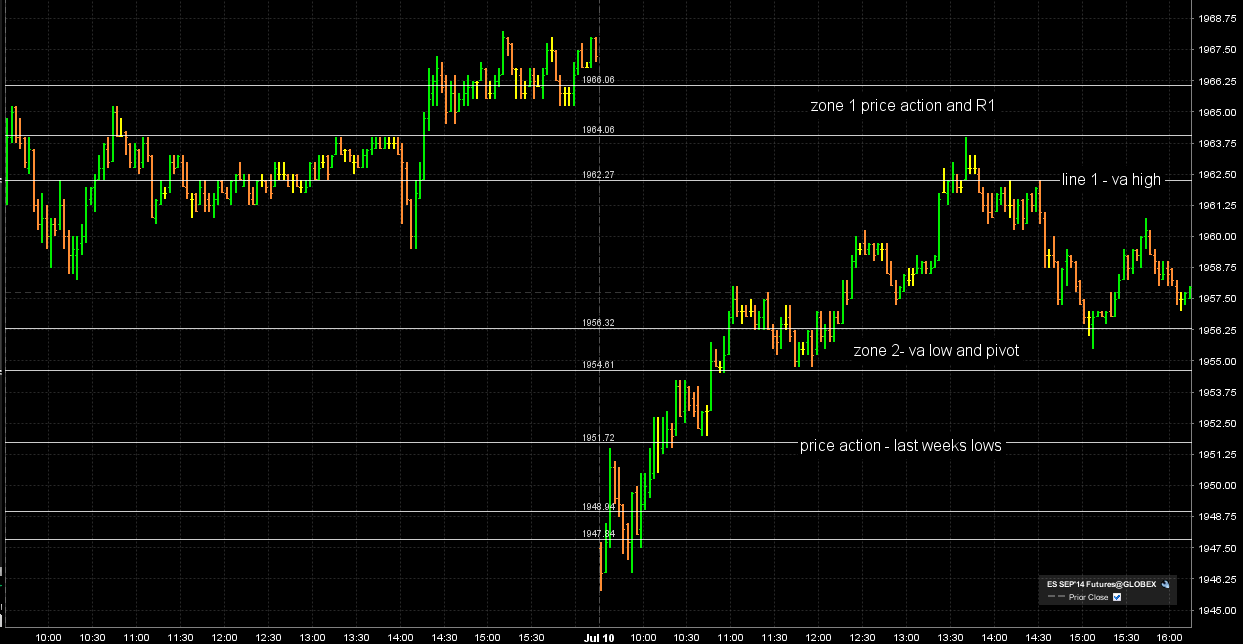
how my chart sees it...I have a two areas to watch for sells ...a zone that includes YD highs and the r1 ( 64 - 66.25)for today and also the va high 62.75......and only two buy areas...one is a buy zone at the va low and pivot ( 55 - 56) and the other is price action based down near 51.....I think it will be best to wait until an Overnight high or low is broken before trading today....hopefully that will come BEFORE the midpoint of the overnight range prints....
Click image for original size
i have 54.25-55.5 (yest lvn and aft swing low) as a quick buy zone, and i mean quick because it will will either work quickly or it won't...56.75-58.25 hvn from yest is above and is obviously a scale zone if long...then i have 60.25 that coincides with the current o/n midpoint so that will be a scale as well....above 60.25 i have 64 (just as bruce does) but i think trading above 64-64.5 will likely push it to 67.5-68.25 so i won't try short till then if 64ish fails...above 67.5-68.25 i have 69.75-72 (nvpoc there with onh and a gap as well)
below 54.25-55.5 i see that 51.25-52.75 (yes it s close to the other one) but i will treat it with caution especailly if internals are suggesting continuation to the downside...belowt 45.25-47.5 is a potential bounce area with yest lows and a small hvn...if we break yest lows i would think mid 30s (36-37) is in play
below 54.25-55.5 i see that 51.25-52.75 (yes it s close to the other one) but i will treat it with caution especailly if internals are suggesting continuation to the downside...belowt 45.25-47.5 is a potential bounce area with yest lows and a small hvn...if we break yest lows i would think mid 30s (36-37) is in play
the ideal situation for me would be to find buys at the 55 - 56 zone and then target up into 58 - 59......keeping everything smaller today because it's friday and don't want to have to play hard and also lose big on a friday if wrong on my plan...current midpoint is right near the POC of yesterday so hopefully a good magnet price
Thanks, Bruce.
it's amazing, how that 64 area has remained pivotal throughout the week...You talked about it early in the week, and then again either yesterday or Wednesday... That 64 area was visited from above and from below... (in addition to the importance it established through PA, 50% of last week's RTH range = 1964.25... once it was broken from above, it became resistance.. I am not trying to be a smart alec here, Sometimes, the simplest things can be overlooked...I think of 50% levels as fulcrum points... .
it's amazing, how that 64 area has remained pivotal throughout the week...You talked about it early in the week, and then again either yesterday or Wednesday... That 64 area was visited from above and from below... (in addition to the importance it established through PA, 50% of last week's RTH range = 1964.25... once it was broken from above, it became resistance.. I am not trying to be a smart alec here, Sometimes, the simplest things can be overlooked...I think of 50% levels as fulcrum points... .
Thank you, too, APK for including descriptions of your price points of interest
on my data we have two sets of single prints left from yesterday.....so I would trade harder at lower edge of first zone because single print is at 54.75...other single is at the 51.50...we have an S2 at 48 today but don't plan on being in on long fades at such low levels...
starting small at 56.50....my plan will be to add harder at 54.75 but keeping entire campaign small
coming all out at 59........damn...was hoping to get more working but buyers were quick...somebody must be copying us ...LOL
I need to see them get to 54.75 before thinking about another small long.....there are really no targets now that midpoint is essentially taken over and poc was tested....so higher risk leads me to wait for lower prices...
agree 100%...tougher trade now that we teted above and failed
Originally posted by BruceM
I need to see them get to 54.75 before thinking about another small long.....there are really no targets now that midpoint is essentially taken over and poc was tested....so higher risk leads me to wait for lower prices...
many people will look at YD as a big reversal type bar but the weak longs may need to be flushed out a bit if it truely is a reversal bar and a new swing low on the daily timeframe is going to push to new highs...I'm trying again and using 56.25 as a target...keeping this mini sized
Out with small profit, nice hit Bruce
Emini Day Trading /
Daily Notes /
Forecast /
Economic Events /
Search /
Terms and Conditions /
Disclaimer /
Books /
Online Books /
Site Map /
Contact /
Privacy Policy /
Links /
About /
Day Trading Forum /
Investment Calculators /
Pivot Point Calculator /
Market Profile Generator /
Fibonacci Calculator /
Mailing List /
Advertise Here /
Articles /
Financial Terms /
Brokers /
Software /
Holidays /
Stock Split Calendar /
Mortgage Calculator /
Donate
Copyright © 2004-2023, MyPivots. All rights reserved.
Copyright © 2004-2023, MyPivots. All rights reserved.