I will start this week with overview of the Euro.
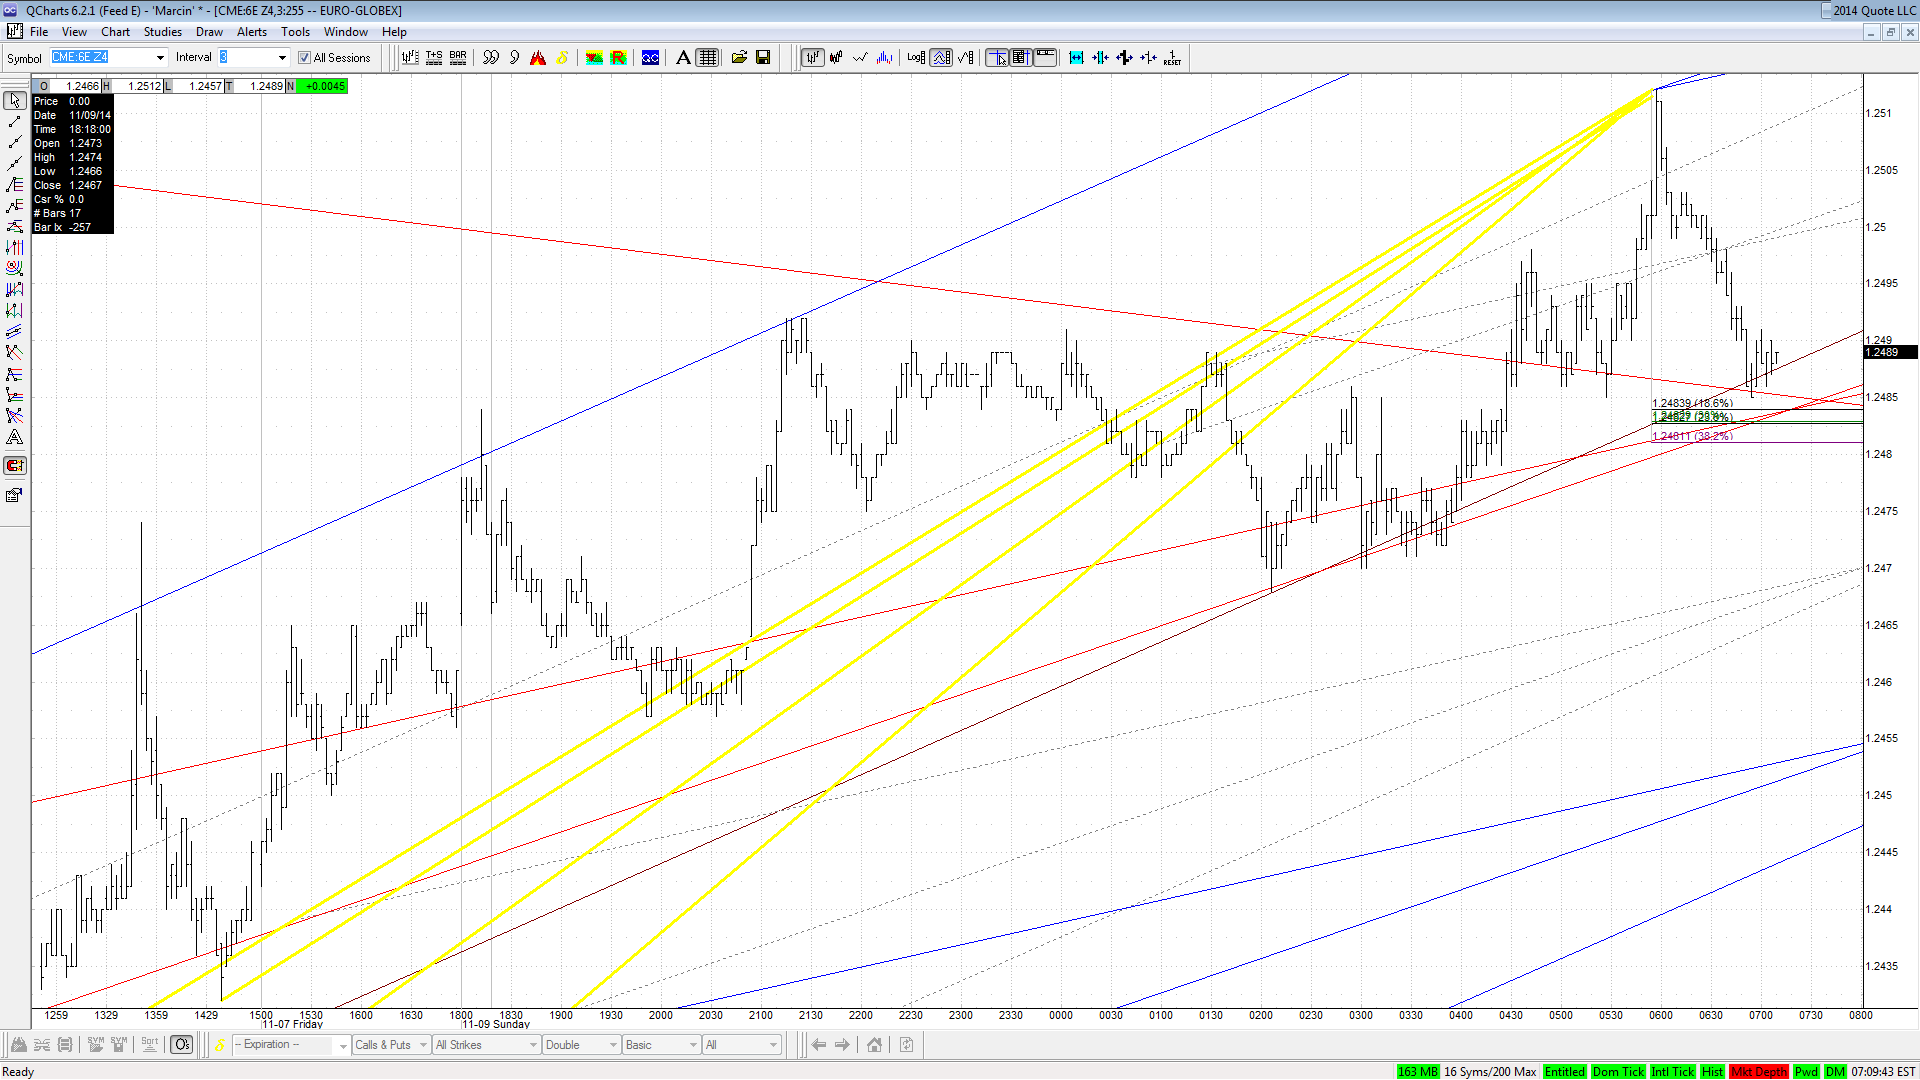
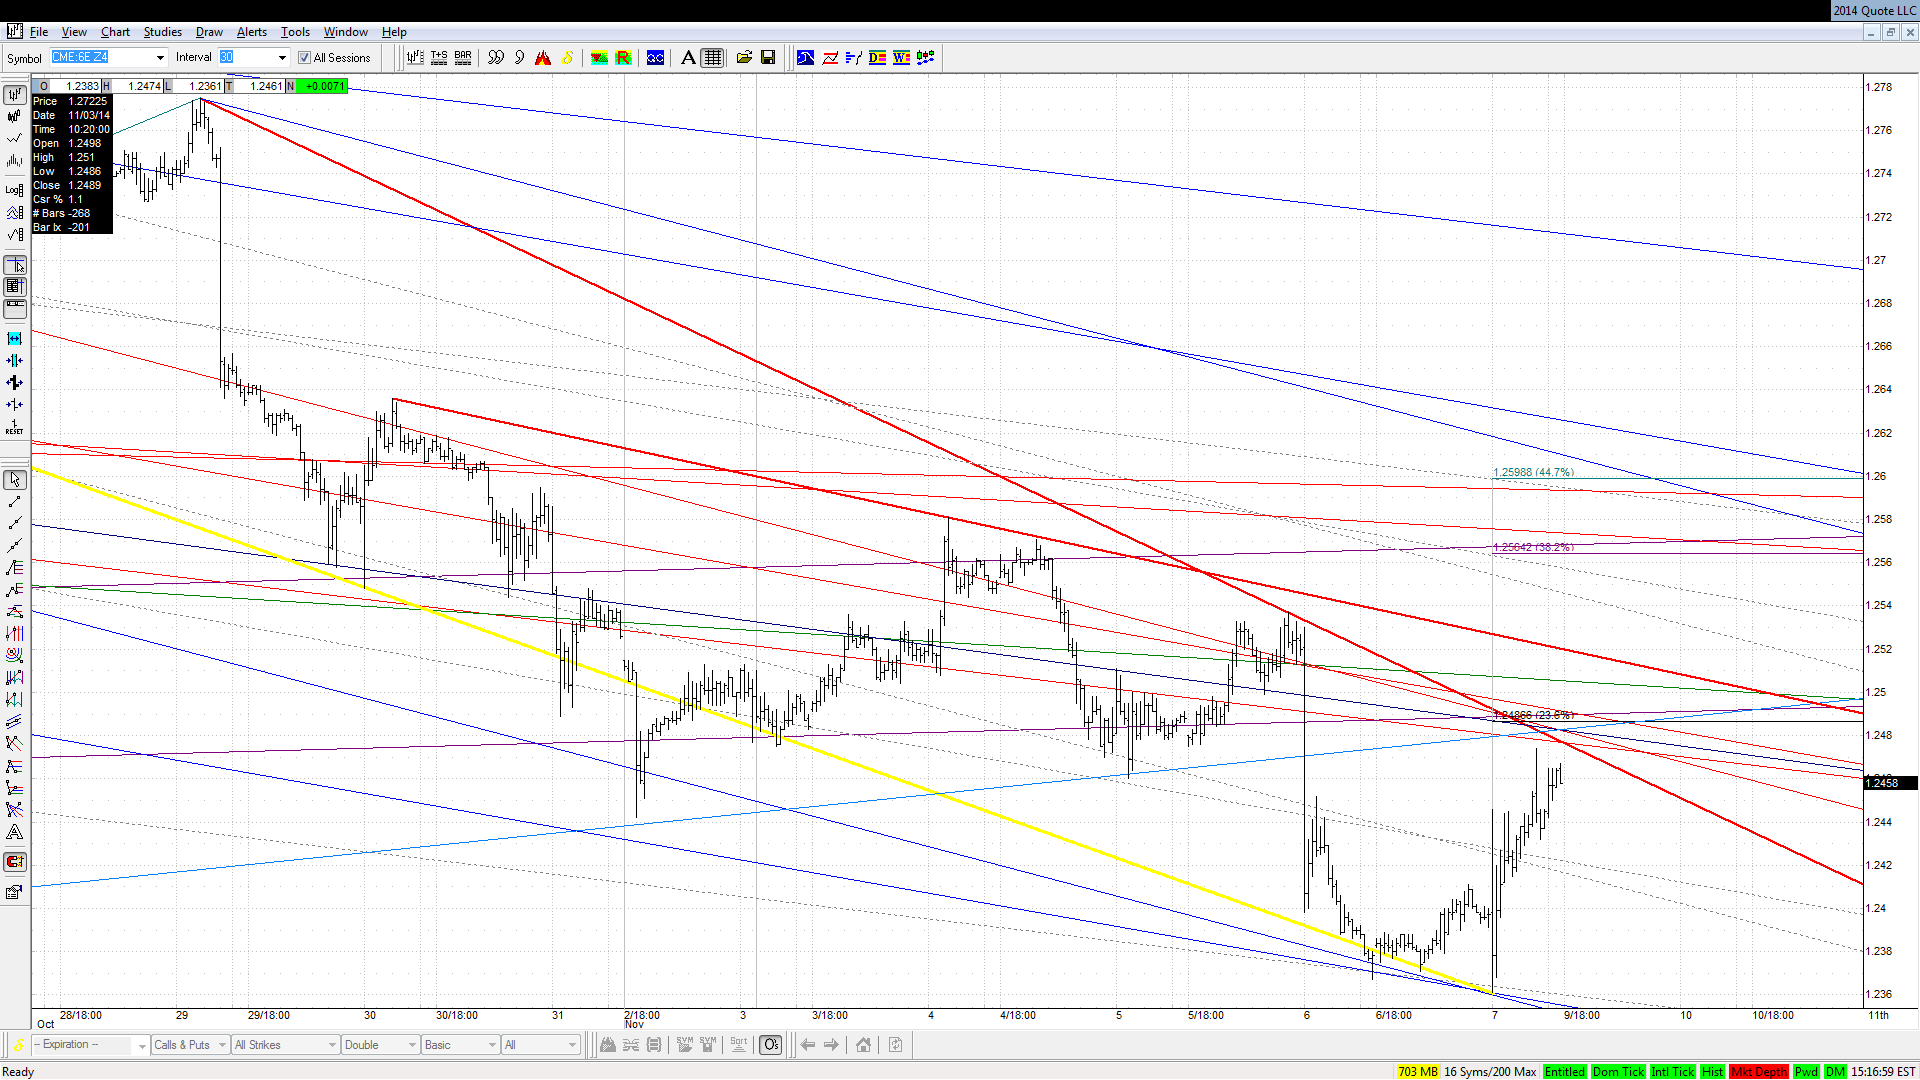
1.2480 looks like a monster, but I assume it will produce only a temporary reaction after TL fakeout and then go up to KZ (1.2570-1.2600).
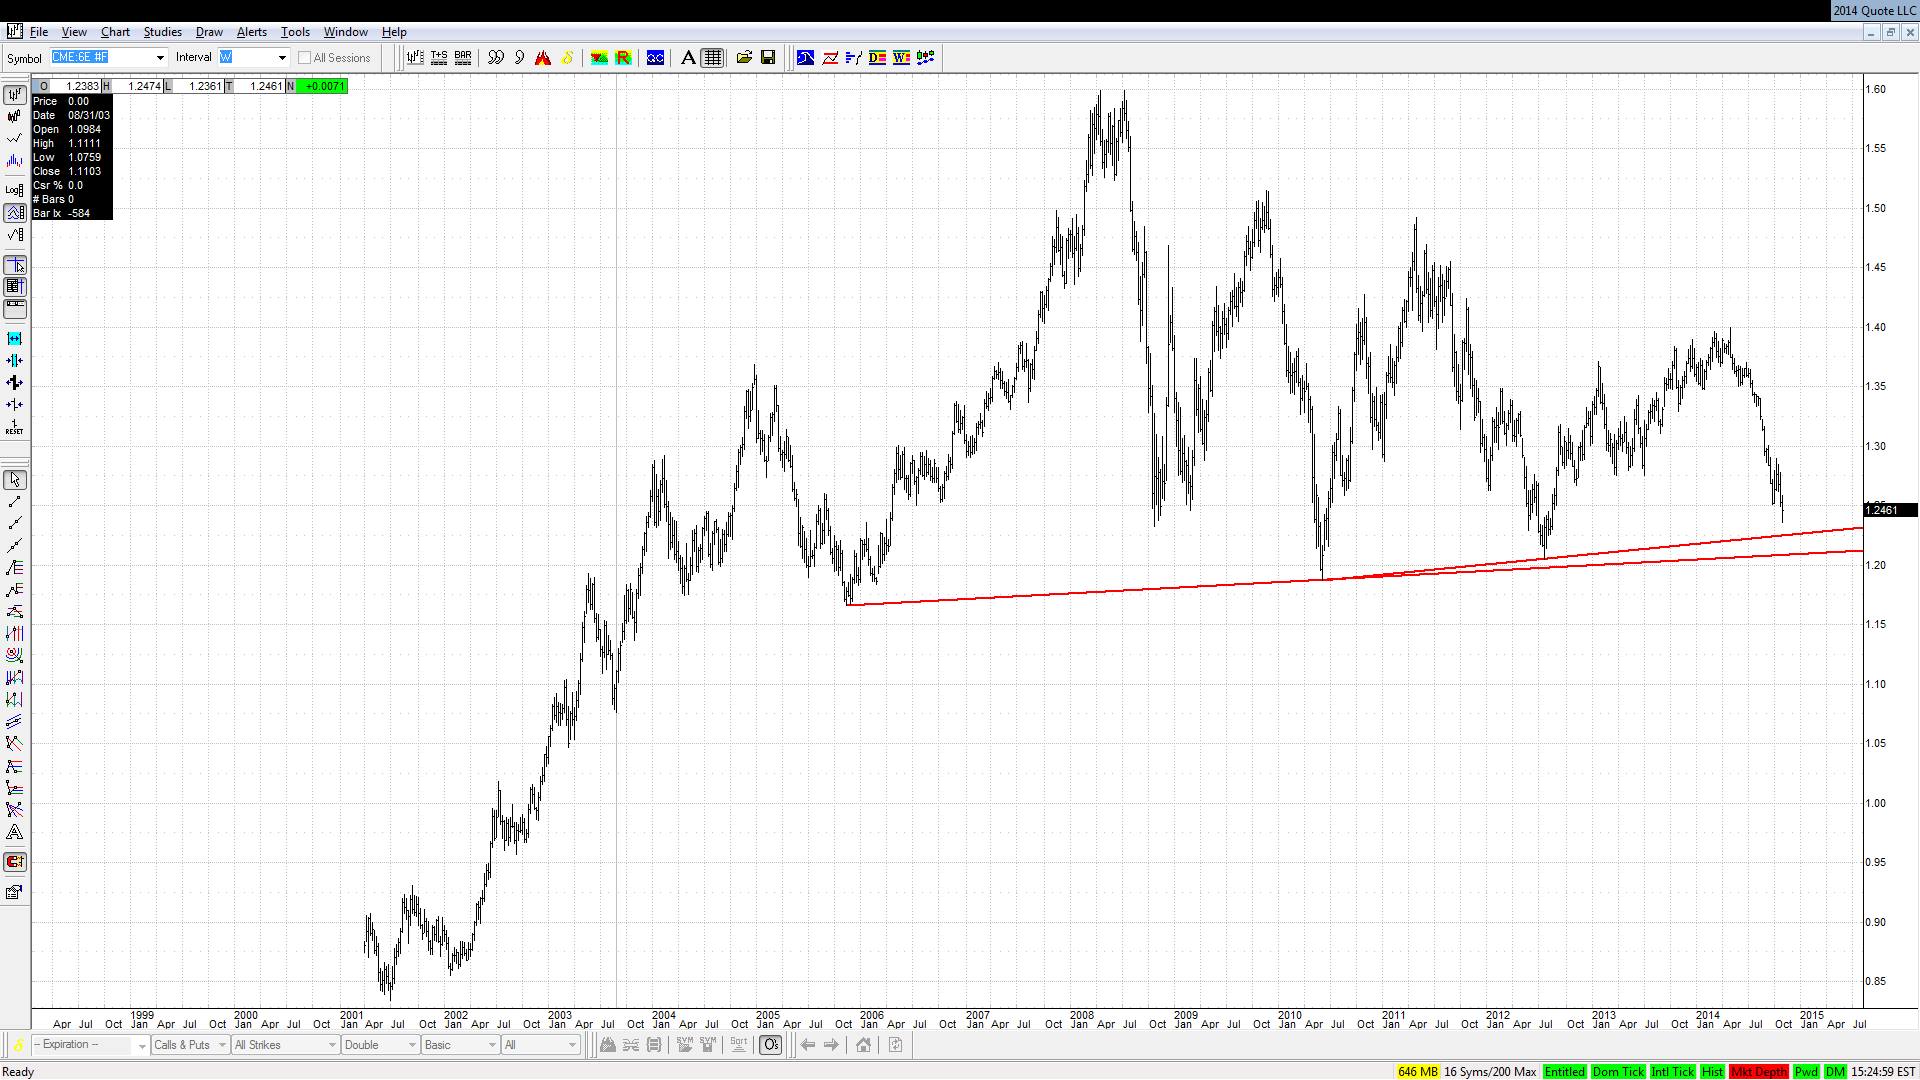
The weekly chart shows a great potential for games around 1.2.
MA
MarcinO
Rep: 67
Posts: 5,506
Assuming a small (on a weekly time frame) fakeout of those two TLs, the Euro may go as low as 1.1850 and still be set up for reversal or a strong correction to the upside.
JI
jimkane
Rep: 3,058
Posts: 33,089
Another boring Sunday. Sundays used to be among my favorite times to trade.
JI
jimkane
Rep: 3,058
Posts: 33,089
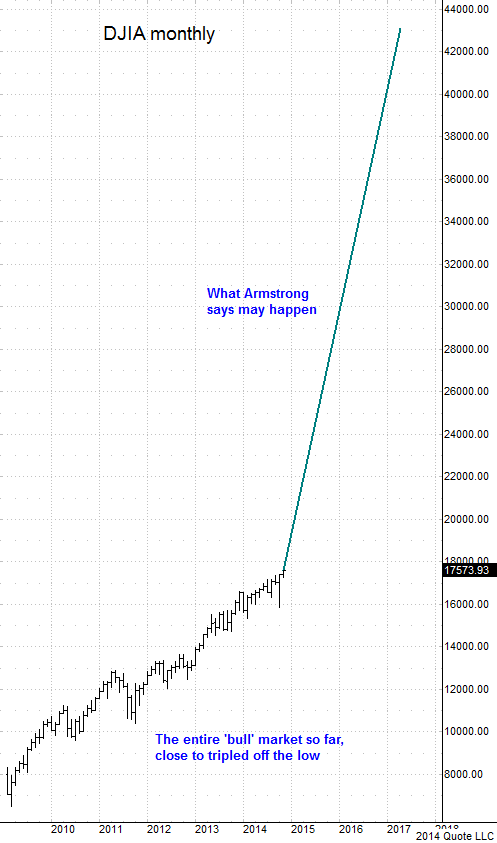
Armstrong is now talking possibly 43,000 on the DOW. Yawn. Maybe after that we'll get a call for 100,000? Wait, isn't that a book? Remember, in the year of their hyperinflation Zimbabwe had the best performing stock market, in nominal terms, in the world. Take a look at the Venezuelan and Argentinian markets when their currencies are declining. But, since inflation is off the table, and only deflation is possible (that's what they say), well, then that can't explain the market going to 45,000, or 100,000...
JI
jimkane
Rep: 3,058
Posts: 33,089
I'm bored, I have no life at all, and I'm just sitting around waiting on the European open so I can see it do nothing and then go to bed. So, I thought I'd show what it would look like if Armstrong's one scenario played out. I couldn't really show this the way I wanted, because I couldn't find a way to have a chart that went up say four screens, since my screens are laid out left to right. I did the best I could.
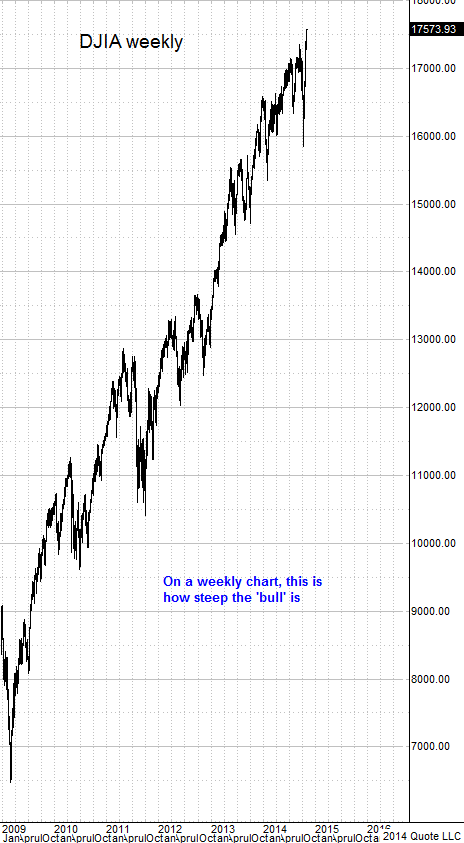
Here's the 'bull' market on a weekly chart (I had to scrunch it in) to show how steep and utterly relentless it has been.
Now on to the monthly chart to show Armstrong's scenario, keeping in mind to scale this so I could show the upper value, it makes the entire 'bull' so far look like it has a very shallow slope upwards. Hence the first chart. If I expanded the first chart even one click wider it about doubled the chart width, making a direct comparison impossible. So, as you look at this, do two things. First imagine that the 'bull' is as steep as it really is, and second, imagine how steep the Armstrong part would be if the 'bull' so far was shown as steep as it is.
What do you think of those bananas? Would that be something, or what? If some top people think the market is overvalued by at least 100% now ( http://www.zerohedge.com/news/2014-11-09/interviewing-john-hussman-market-overvalued-100 ), and that is without many other considerations I'd consider (like fraction reserve lending, to name one, and artificial rates to name another), and I think S&P fair value is about 400 (making it 5x overvalued now), what will it be if this happens? Too funny. And I bet a zillion dollars if this happens the talking heads on bubblevision would be saying it's the buy of the century, extremely undervalued.
Charts created on QCharts, courtesy eSignal
Here's the 'bull' market on a weekly chart (I had to scrunch it in) to show how steep and utterly relentless it has been.
Now on to the monthly chart to show Armstrong's scenario, keeping in mind to scale this so I could show the upper value, it makes the entire 'bull' so far look like it has a very shallow slope upwards. Hence the first chart. If I expanded the first chart even one click wider it about doubled the chart width, making a direct comparison impossible. So, as you look at this, do two things. First imagine that the 'bull' is as steep as it really is, and second, imagine how steep the Armstrong part would be if the 'bull' so far was shown as steep as it is.
What do you think of those bananas? Would that be something, or what? If some top people think the market is overvalued by at least 100% now ( http://www.zerohedge.com/news/2014-11-09/interviewing-john-hussman-market-overvalued-100 ), and that is without many other considerations I'd consider (like fraction reserve lending, to name one, and artificial rates to name another), and I think S&P fair value is about 400 (making it 5x overvalued now), what will it be if this happens? Too funny. And I bet a zillion dollars if this happens the talking heads on bubblevision would be saying it's the buy of the century, extremely undervalued.
Charts created on QCharts, courtesy eSignal
JI
jimkane
Rep: 3,058
Posts: 33,089
Let me add: look on the weekly at how steep the last three years have been (crazy steep and uncorrected), and look on the monthly chart at that last three years and the slope of the Armstrong scenario. The move, running over two years from here, would be substantially steeper. Look on the weekly chart and try to visualize a much, much steeper slope running for more than two years pushing towards a tripling from here. Huh? Let me reiterate: Huh? If this happens is that insane, or what?
JI
jimkane
Rep: 3,058
Posts: 33,089
BTW, I am short side bias in the very short term, and expecting a big pop on the open to trash that. If I like short side here, you can bet 'they' know that, and want to get everyone off that side. So, watch and see what happens. I hope not, I hope they just dump it, but I know how they think, too.
JI
jimkane
Rep: 3,058
Posts: 33,089
Nah, didn't see that pop on the European open coming at all, did I? Same old, same old. It's just a matter of knowing how they think...
JI
jimkane
Rep: 3,058
Posts: 33,089
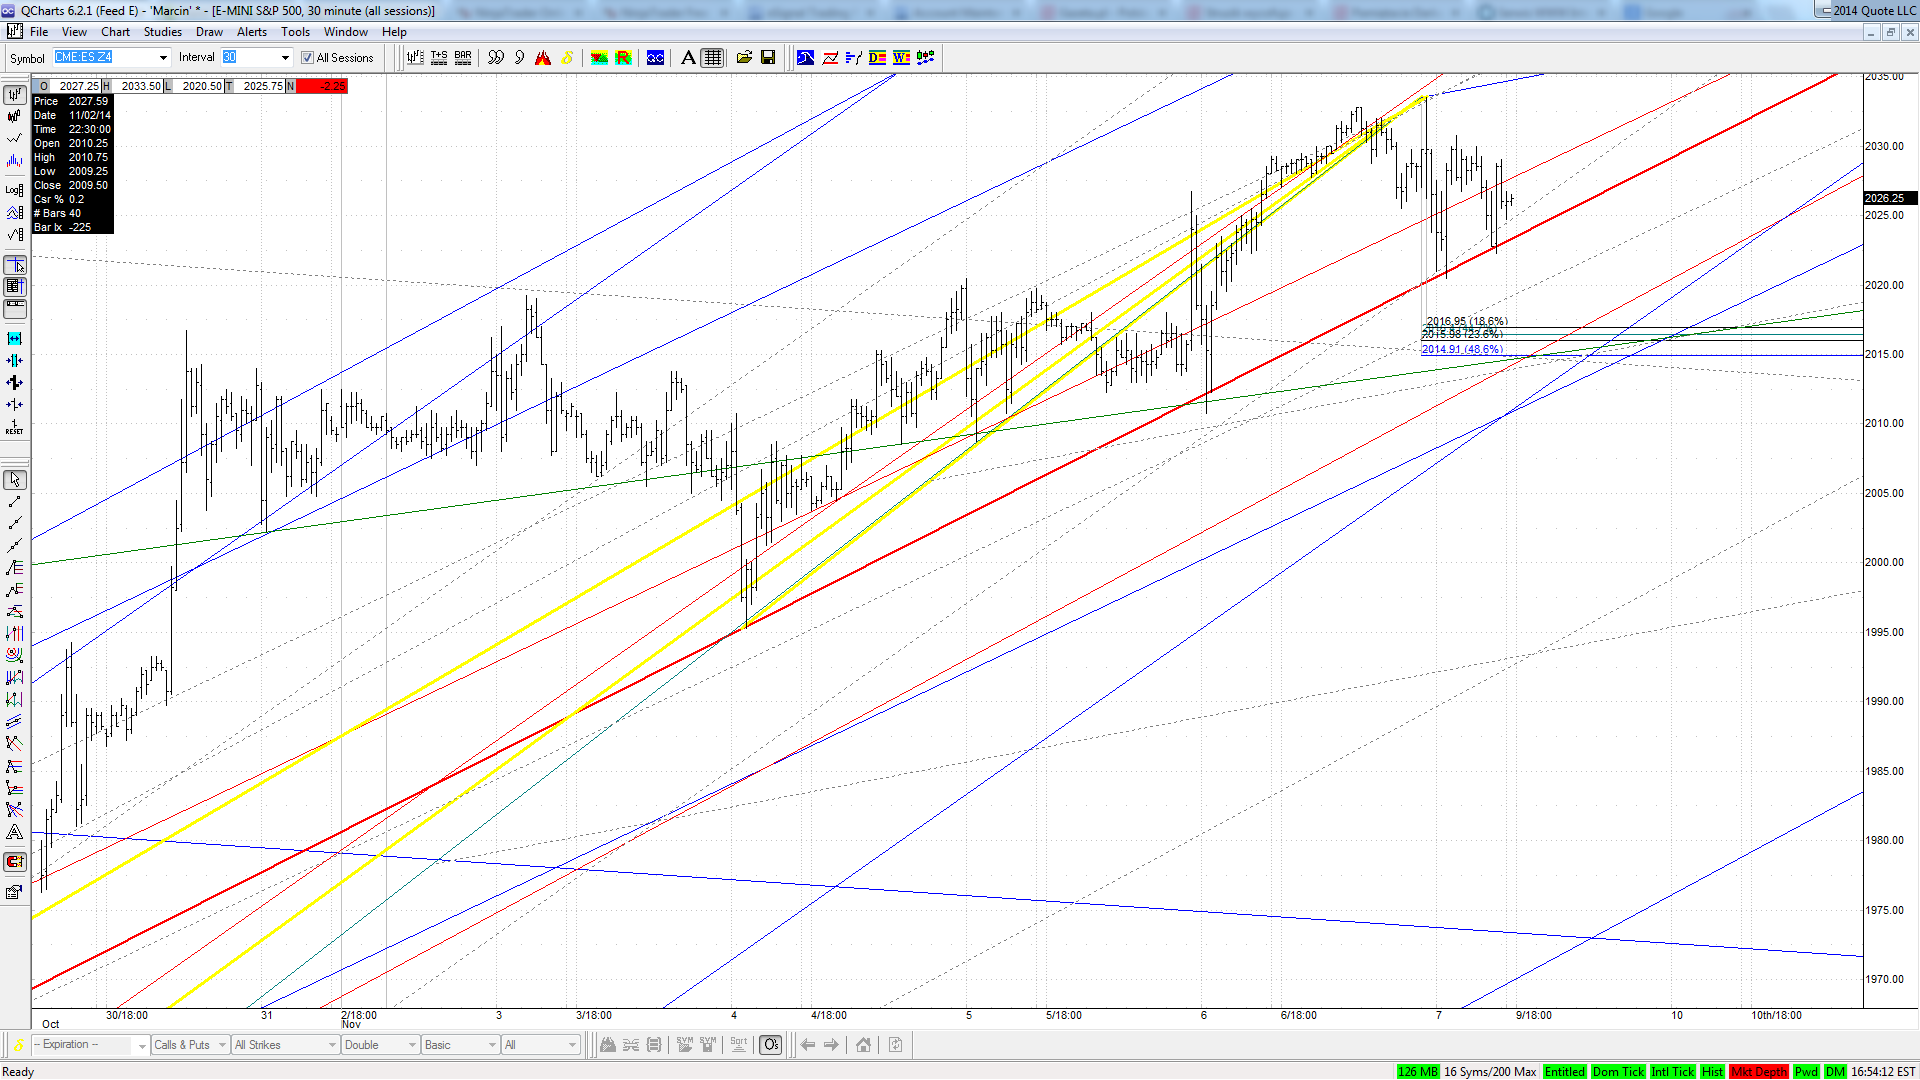
Here's the ES game. It's all games, but this is the 'stop run' game, a variation on what I coined long ago, the '1-2-tick game'.
http://www.zerohedge.com/news/2014-11-14/stop-hunting-algos-dominate-sp-500-today