MyPivots
Sign In
MA
MarcinO
Rep: 67
Posts: 5,506
I will start this week with overview of the Euro.
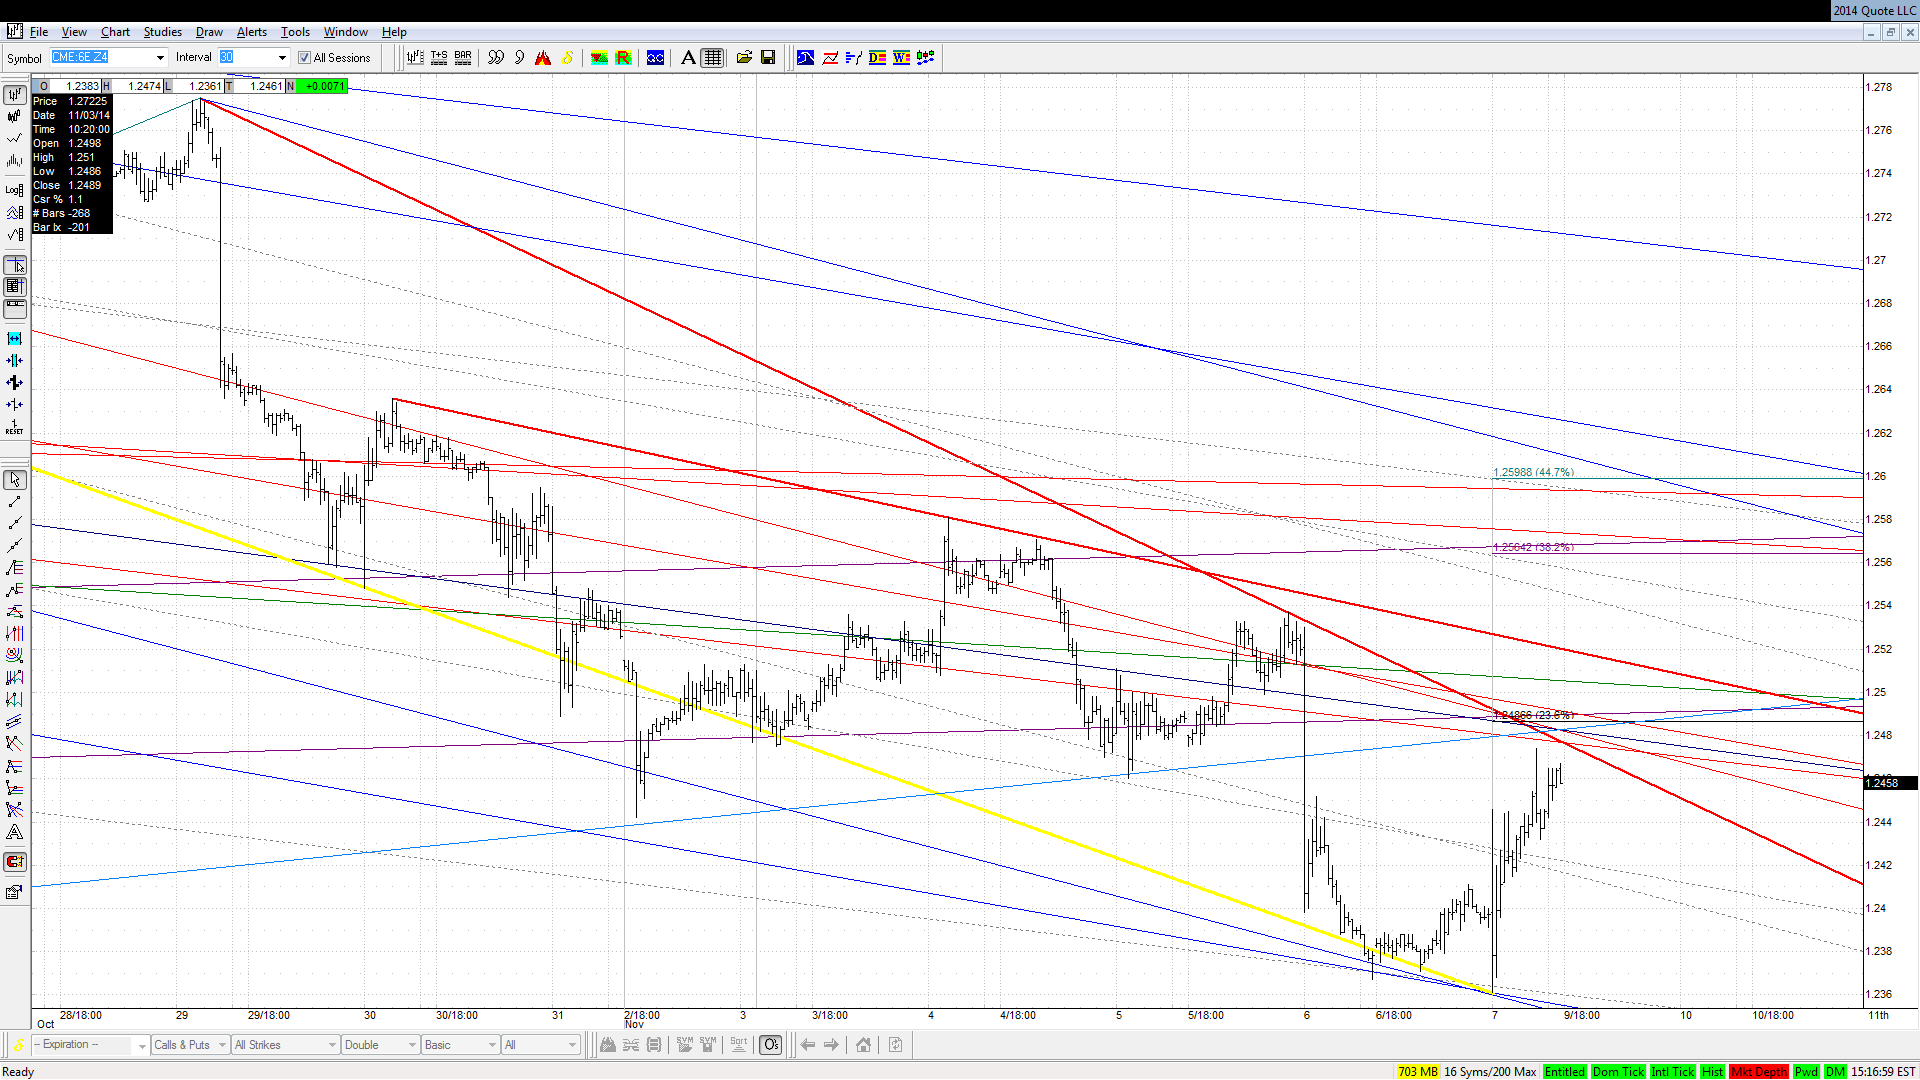
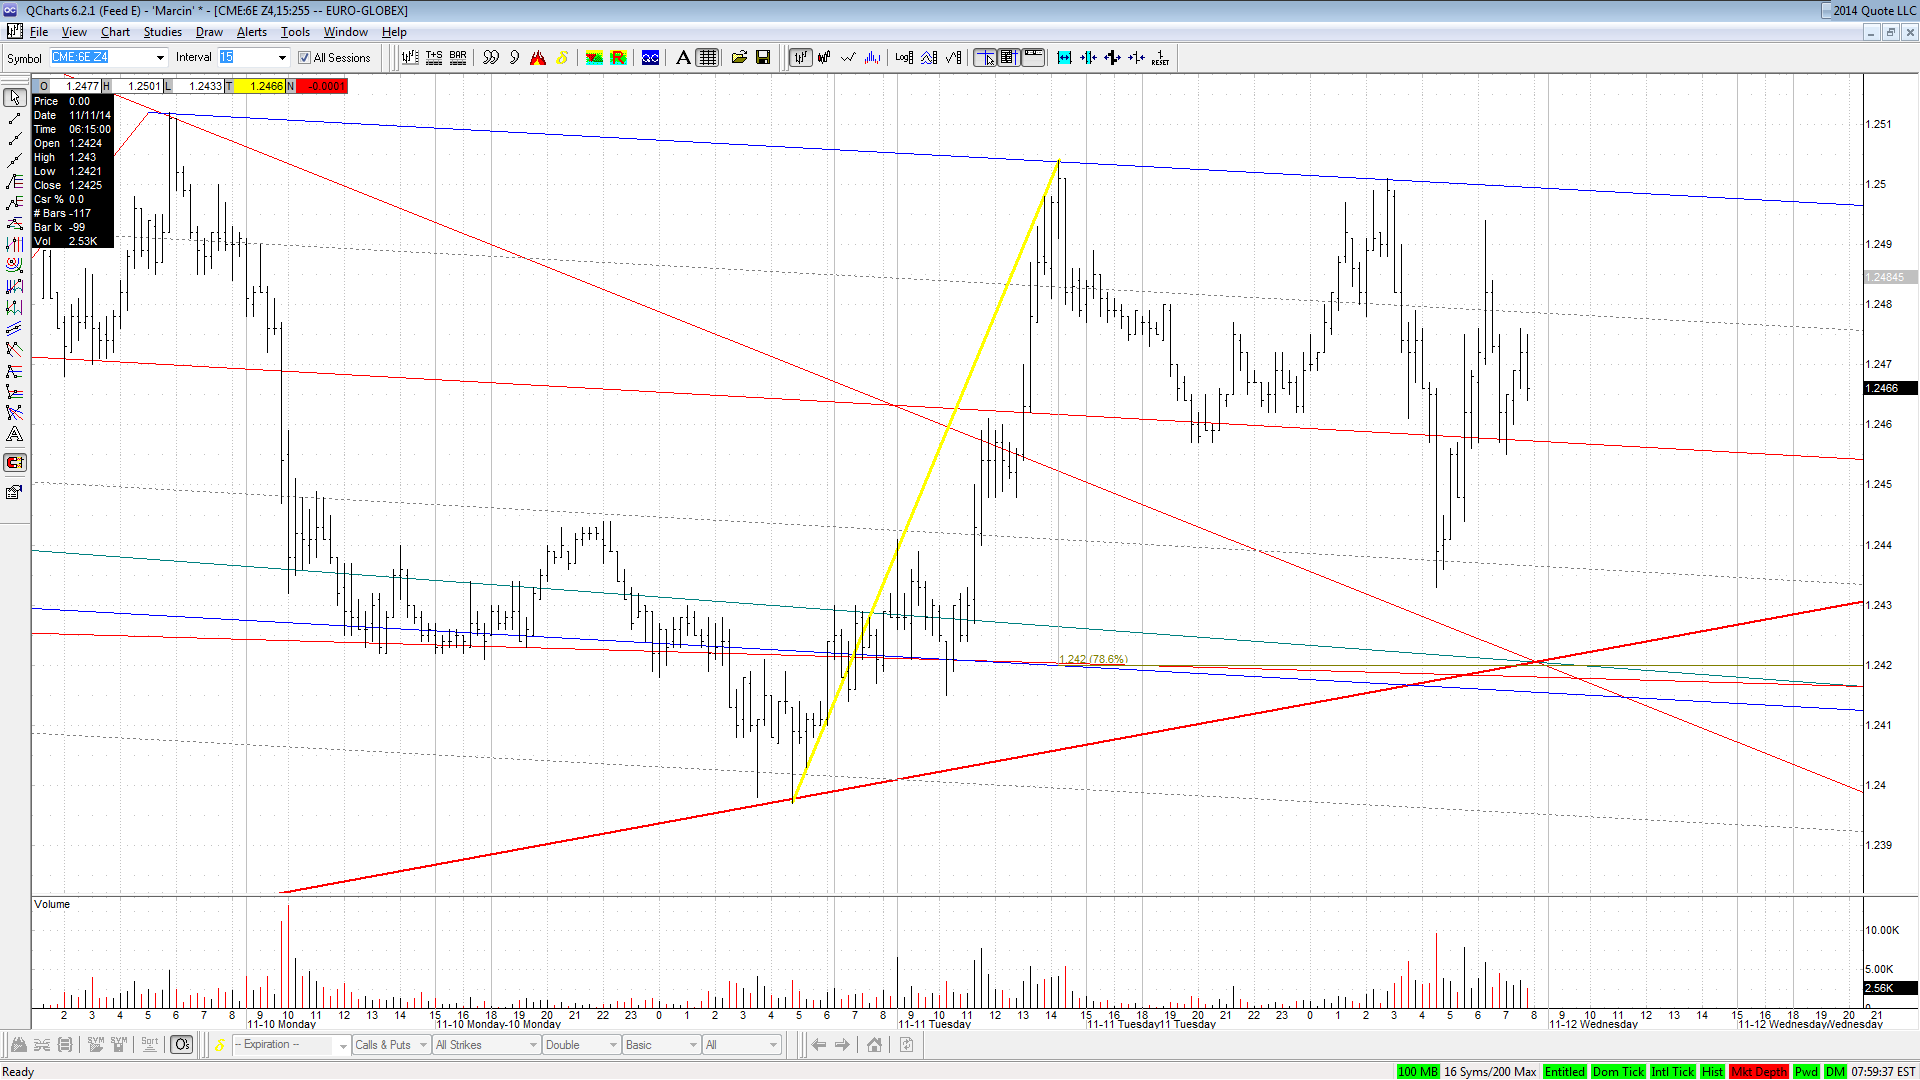
1.2480 looks like a monster, but I assume it will produce only a temporary reaction after TL fakeout and then go up to KZ (1.2570-1.2600).
Click image for original size
6e 2014 11 09 png


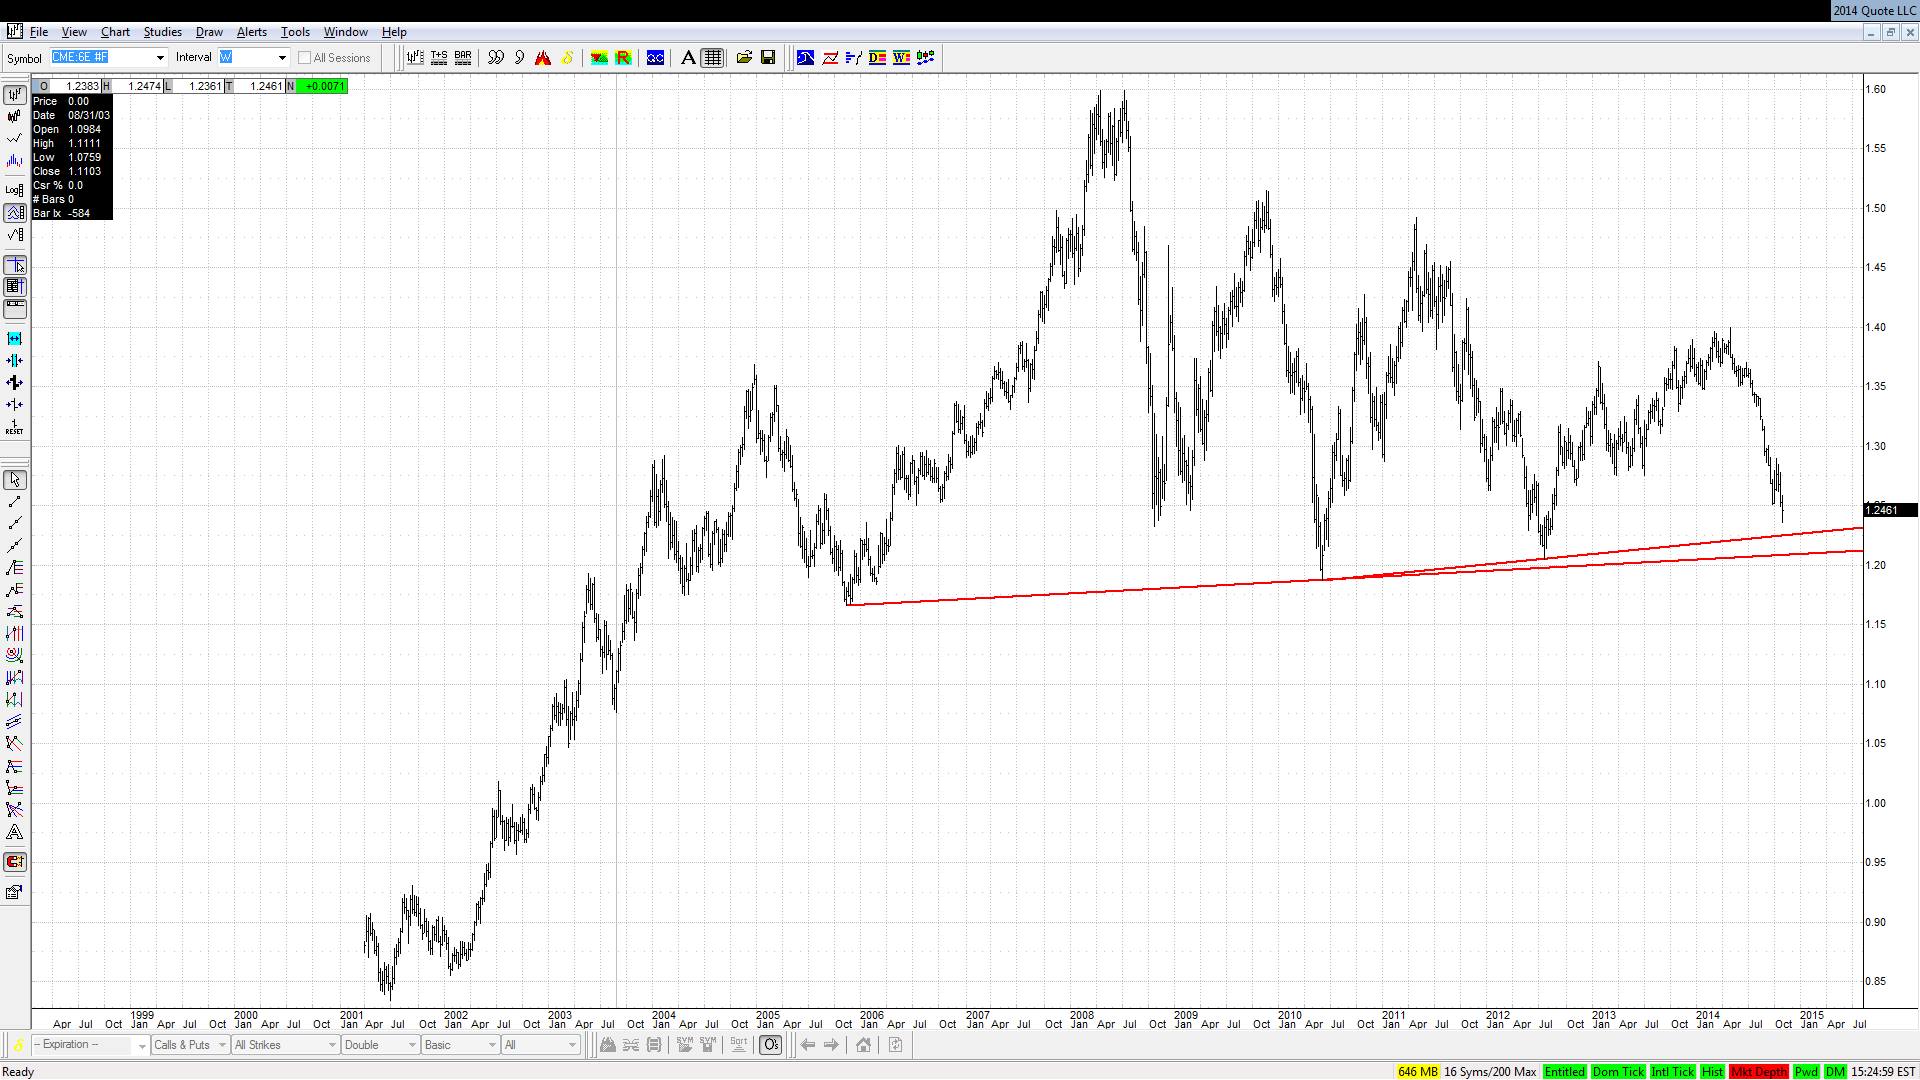
The weekly chart shows a great potential for games around 1.2.

Click image for original size
6e 2014 11 09 weekly png
RA
rat89
Rep: 0
Posts: 7,015
Click image for original size
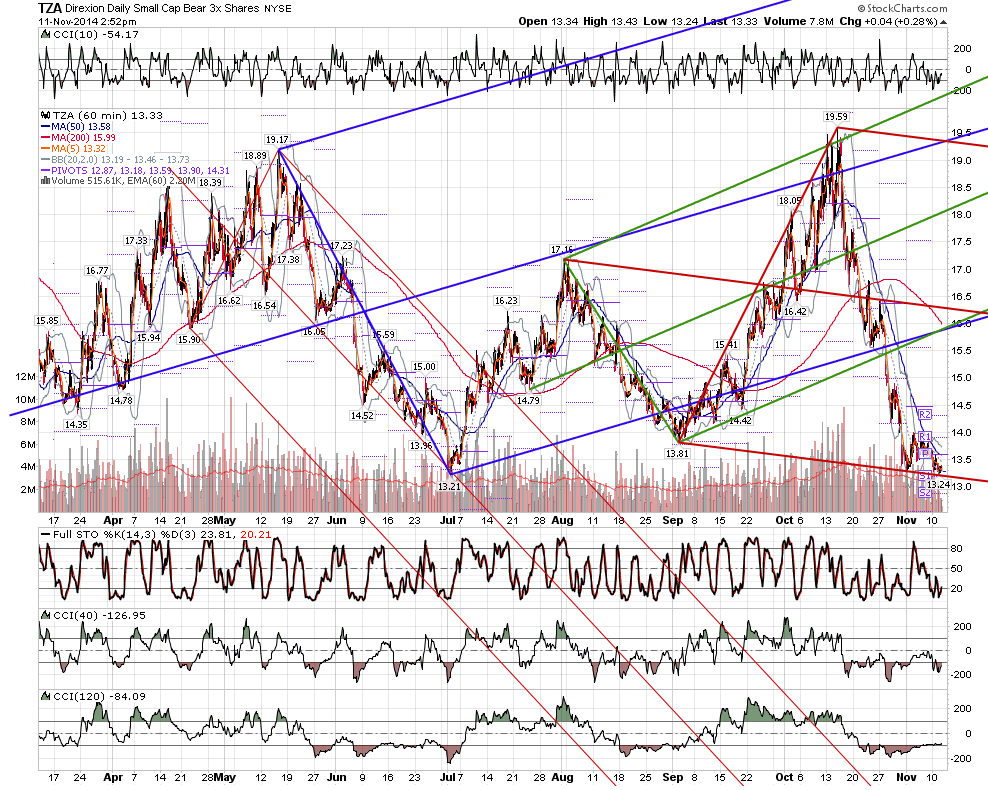
screen shot 2014 11 11 at 2 52 58 pm png
JI
jimkane
Rep: 3,058
Posts: 33,089
That's a lot of nice work, crew.
JI
jimkane
Rep: 3,058
Posts: 33,089
What a slow day. Back to machine trading since the rise off the low settled in to the 'old' routine. Just look at a 60-min RTH chart on the ES and you'll see what I mean. Anyway, this is just a slow grind, stay with the long kind of play, in my opinion. See if they can gun it to another new all-time high here, or if this 36 area kills it.
JI
jimkane
Rep: 3,058
Posts: 33,089
I doubt it means anything, given this is headed to Dow 43,000, right?

http://www.zerohedge.com/news/2014-11-11/2007-deja-vu-all-over-again
JI
jimkane
Rep: 3,058
Posts: 33,089
Fantastic charts. The only one that matters is the second to last one. The decoupling is simply incredible, though, across the board, isn't it? I never thought I'd live to see anything like it.

http://www.zerohedge.com/news/2014-11-11/just-15-wtf-charts
JI
jimkane
Rep: 3,058
Posts: 33,089
Here there be dragons...

Originally posted by rat89

Click image for original size
screen shot 2014 11 11 at 11 22 07 am png

JI
jimkane
Rep: 3,058
Posts: 33,089
Is it time for an assault on the highs to start? It seems early...
MA
MarcinO
Rep: 67
Posts: 5,506
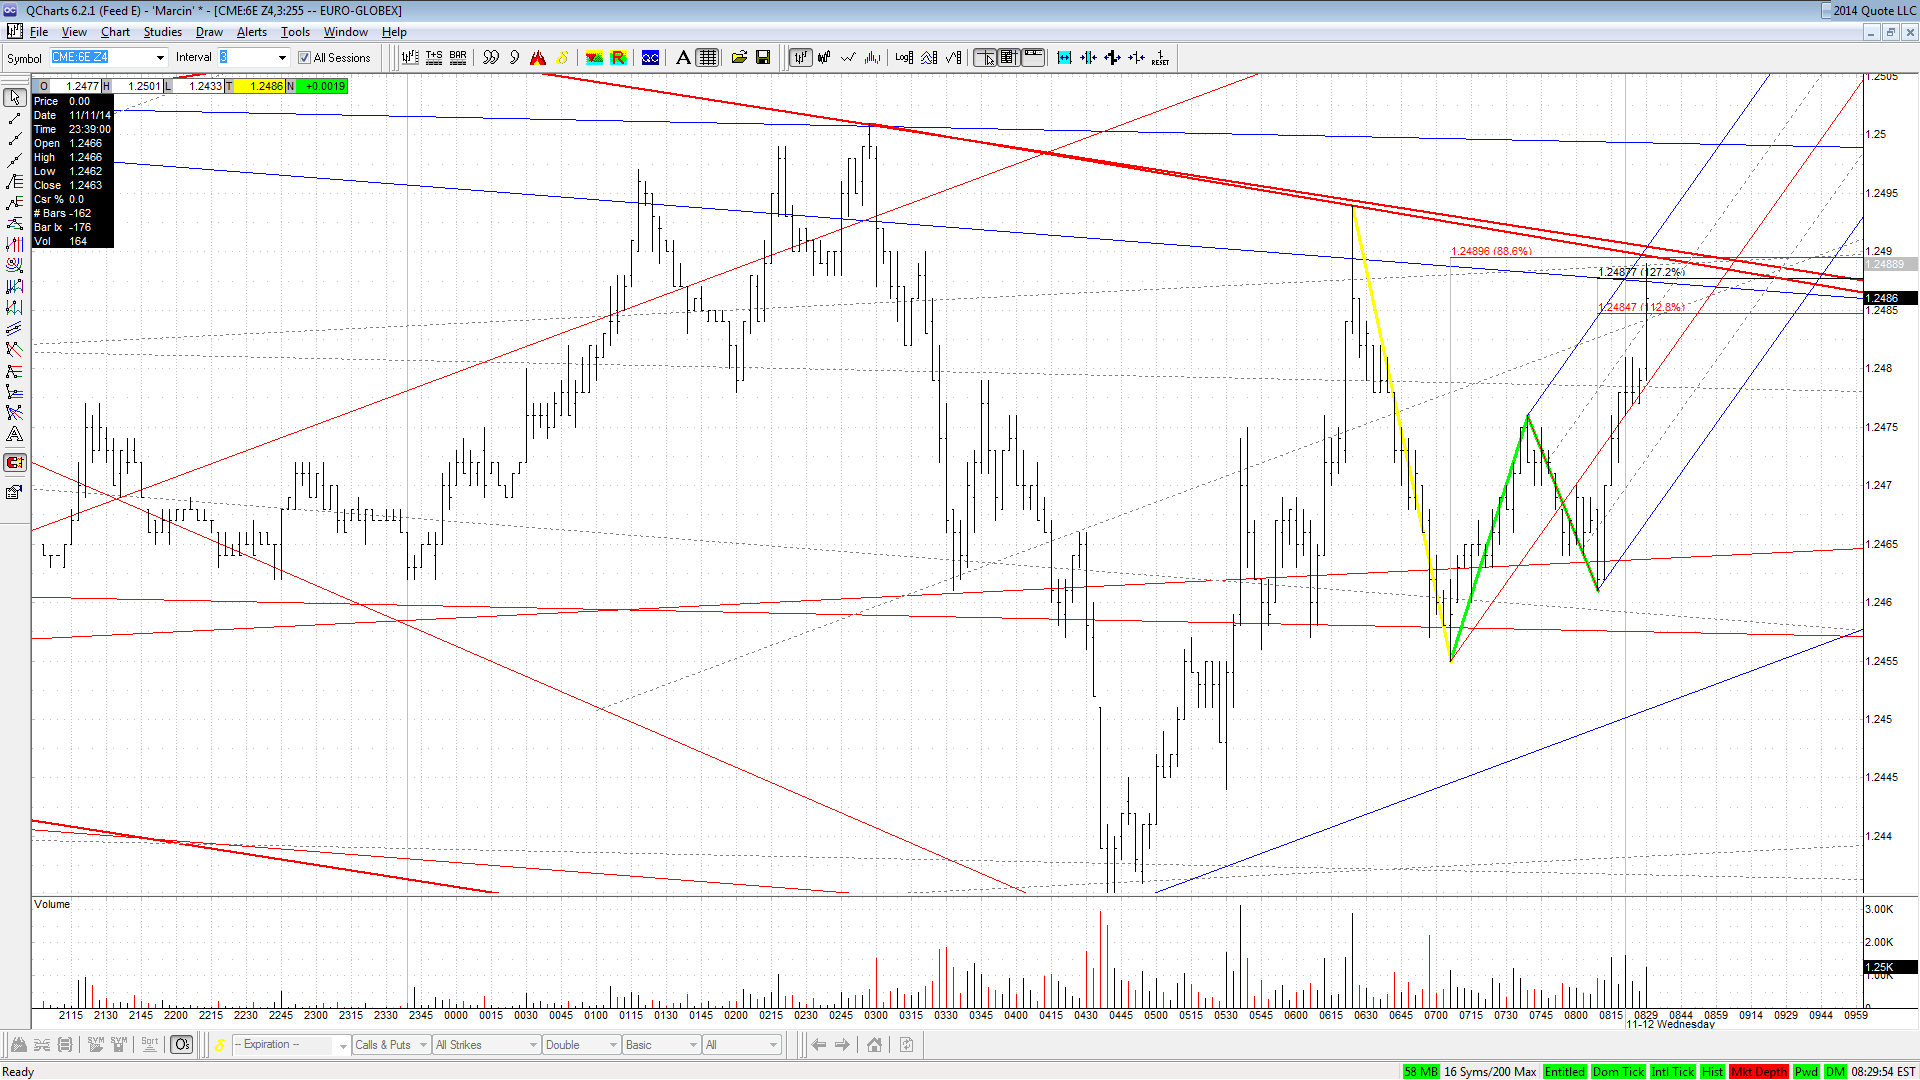
I hope to see 1.2420 hit and produce a solid reaction.

Click image for original size
6e 2014 11 12 png
RA
rat89
Rep: 0
Posts: 7,015
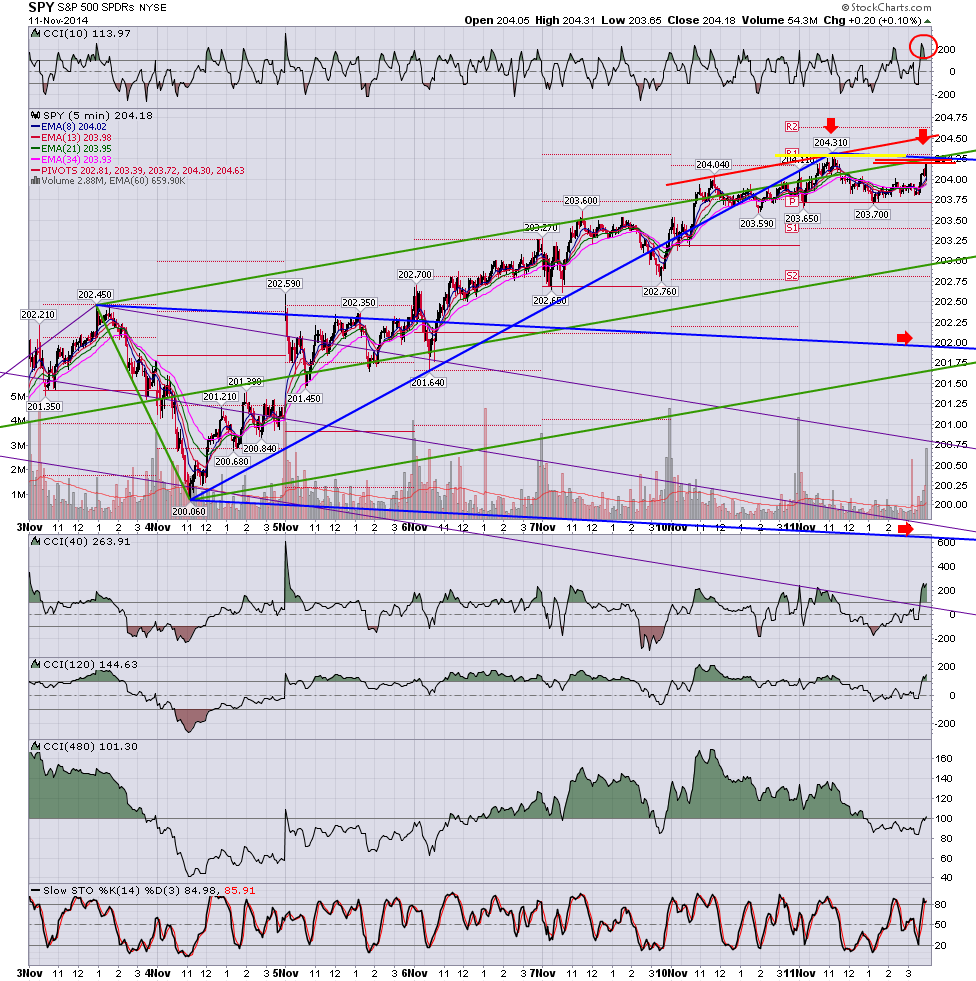
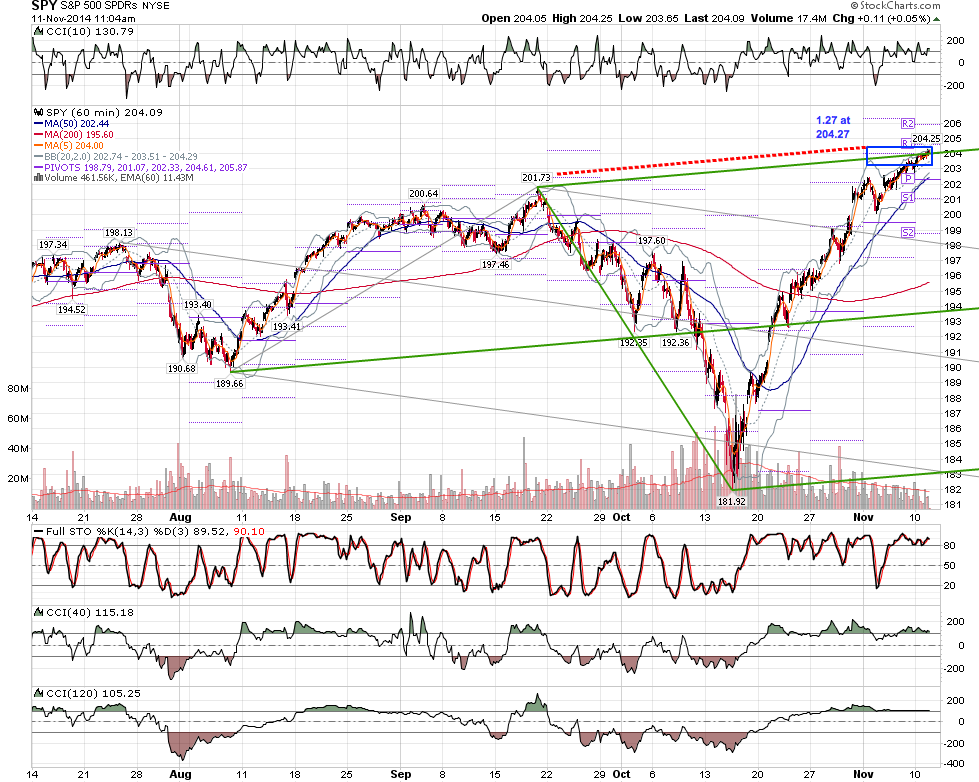
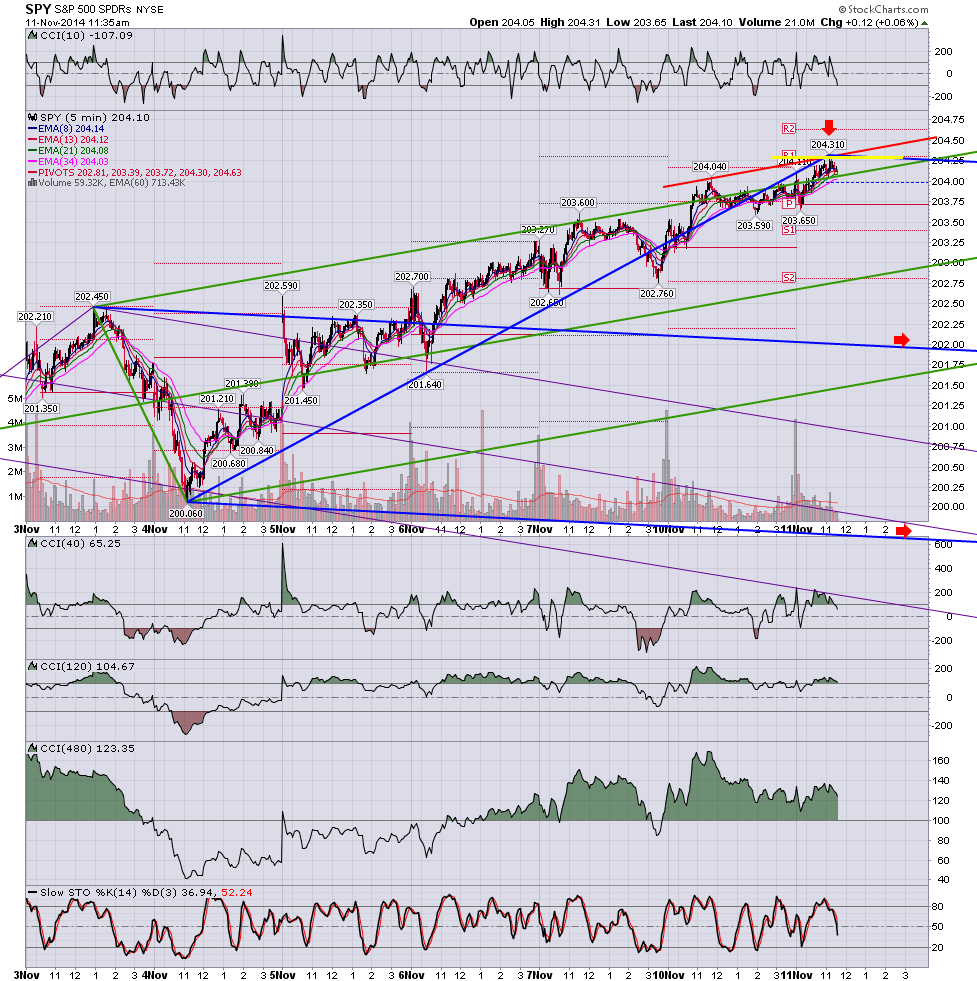
spy 5 and 60 - three charts - first chart is short entry at 11:10 yesterday, second chart is the retest on the closing bar yesterday.....there is a 6¢ fib retracement range from 204.18 - 204.24 at the confluence of lines, with time, as indicated by cci and other cyclical indicators in place......the third chart shows the larger time frame showing a swing exit at 1.27 external retracement with price at upper line target area and once again, time in place. This is not an exact science, and these are just the tools I use, but it is possible to predict when it is more probable to have setups in one direction than the other

Click image for original size
screen shot 2014 11 11 at 11 35 50 am png

Click image for original size
screen shot 2014 11 12 at 7 52 07 am png

Click image for original size
screen shot 2014 11 11 at 11 05 06 am png
MA
MarcinO
Rep: 67
Posts: 5,506
Reversal now?

Click image for original size
6e 2014 11 12 2 png
JI
jimkane
Rep: 3,058
Posts: 33,089
Here's the ES game. It's all games, but this is the 'stop run' game, a variation on what I coined long ago, the '1-2-tick game'.

http://www.zerohedge.com/news/2014-11-14/stop-hunting-algos-dominate-sp-500-today