I have tried filtering on large orders only >999 on the delta with limited success. I look at delta and it seems to help but I also plot a signal marker using Delta for large orders >999 on the one minute chart. Red dot for negative above the price and green dot for positive below the price on the one minute chart only. It gives me a sense for what those large order contracts are doing. Now it can be misleading as well if they are quickly buying and selling - red followed by green, etc. So I look for 3 in a row, uninterupted on the one minute, in the first 60 minutes close to a level we have identified. 3 reds in a row at the top or green at a bottom. This seems to help me more than anything else, but had the end it is just another indicator.
PA
PAUL9
Rep: 14,898
Posts: 1,170
0
New kid, check you PM for description of how to show cum delta
NE
NewKid
Rep: 16,470
Posts: 1,915
0
Paul,
Here is the chart you asked for. I have also emailed it to you.
Click image for original size
PA
PAUL9
Rep: 14,898
Posts: 1,170
0
Thank you newkid
my same style chart but using IB data (snapshots not tick by tick) produced a chart that looked almost exactly opposite when it came to the cum delta bars
TY
NE
NewKid
Rep: 16,470
Posts: 1,915
0
I will have to look into whether Rithmic does tick by tick volume or not
SH
sharks57
Rep: 2,760
Posts: 470
0
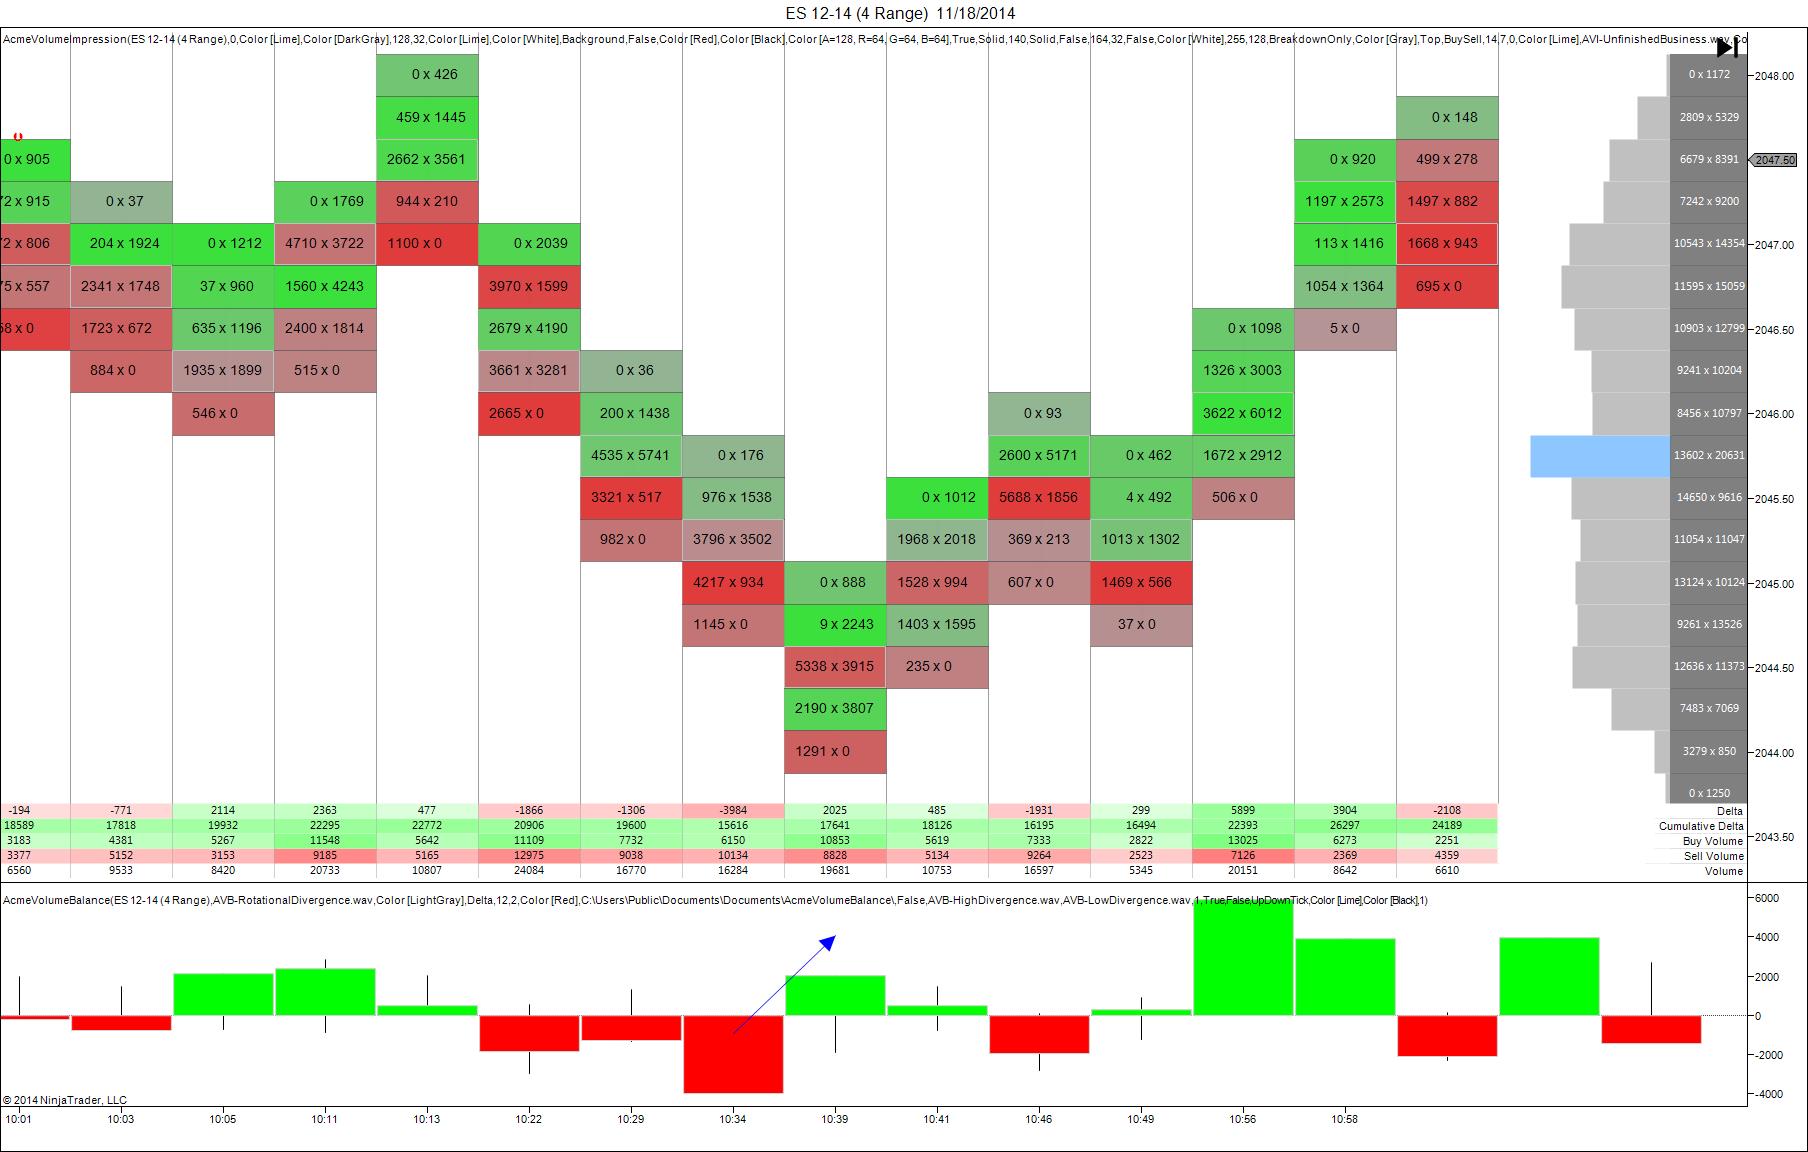
This change in Delta volume happened around 10:38AM. This shows a change in selling vs buying volume coming into the market at the arrow. Notice the total Delta from -3984 to a +2025. A little late but you see the idea.
Click image for original size
NE
NewKid
Rep: 16,470
Posts: 1,915
0
sharks, what data source do you use?
SH
sharks57
Rep: 2,760
Posts: 470
0
Rithmic from my broker.
NE
NewKid
Rep: 16,470
Posts: 1,915
0
Thanks. Looks like you and I are on Rithmic.
Bruce and Paul use IB
SH
sharks57
Rep: 2,760
Posts: 470
0
I can show you spots where that delta Volume change doesn't work as many times as it does. So this was just an example not a trading method. We need to think in terms of other confirmations to coincide with that to filter out the whipsaws IMO.