ES Wednesday 1-7-15
here's how I marked up my chart....Blue lines are Va Highs and lows....will confirm in the morning with Overnight action...FOMC today
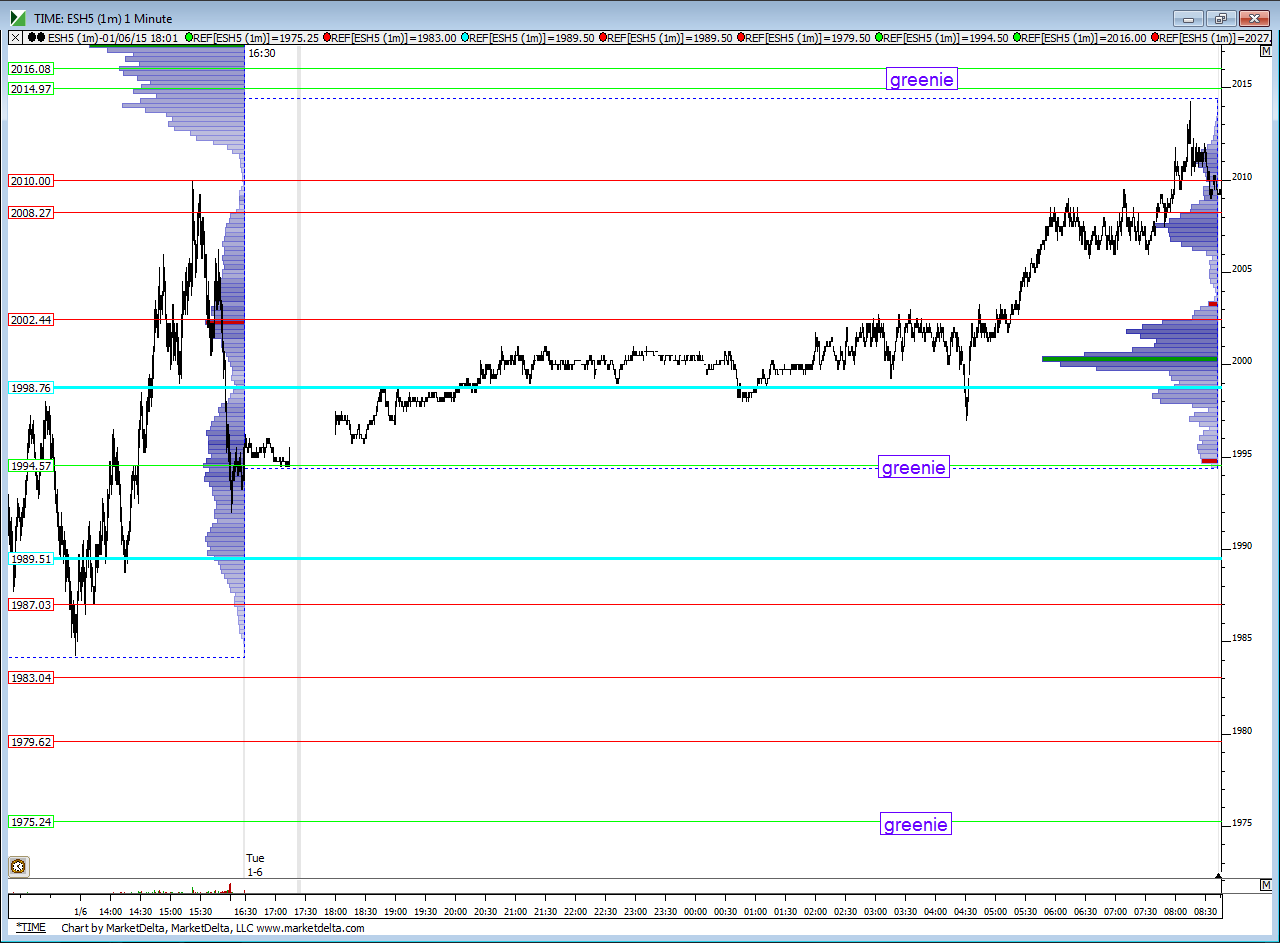
UPDATE :here is how the overnight has played out against our zones.....two greenies on the chart and they will print at least one today ...so Greenies/Volume at 1994.50- 96 and also at 2014- 2015....sure seems like the 2008.50 - 2010 will the deciding factor as to which one will print today....also watch that 2002.50- 2004 as that was a key line and On midpoint rests there as I type
Click image for original size
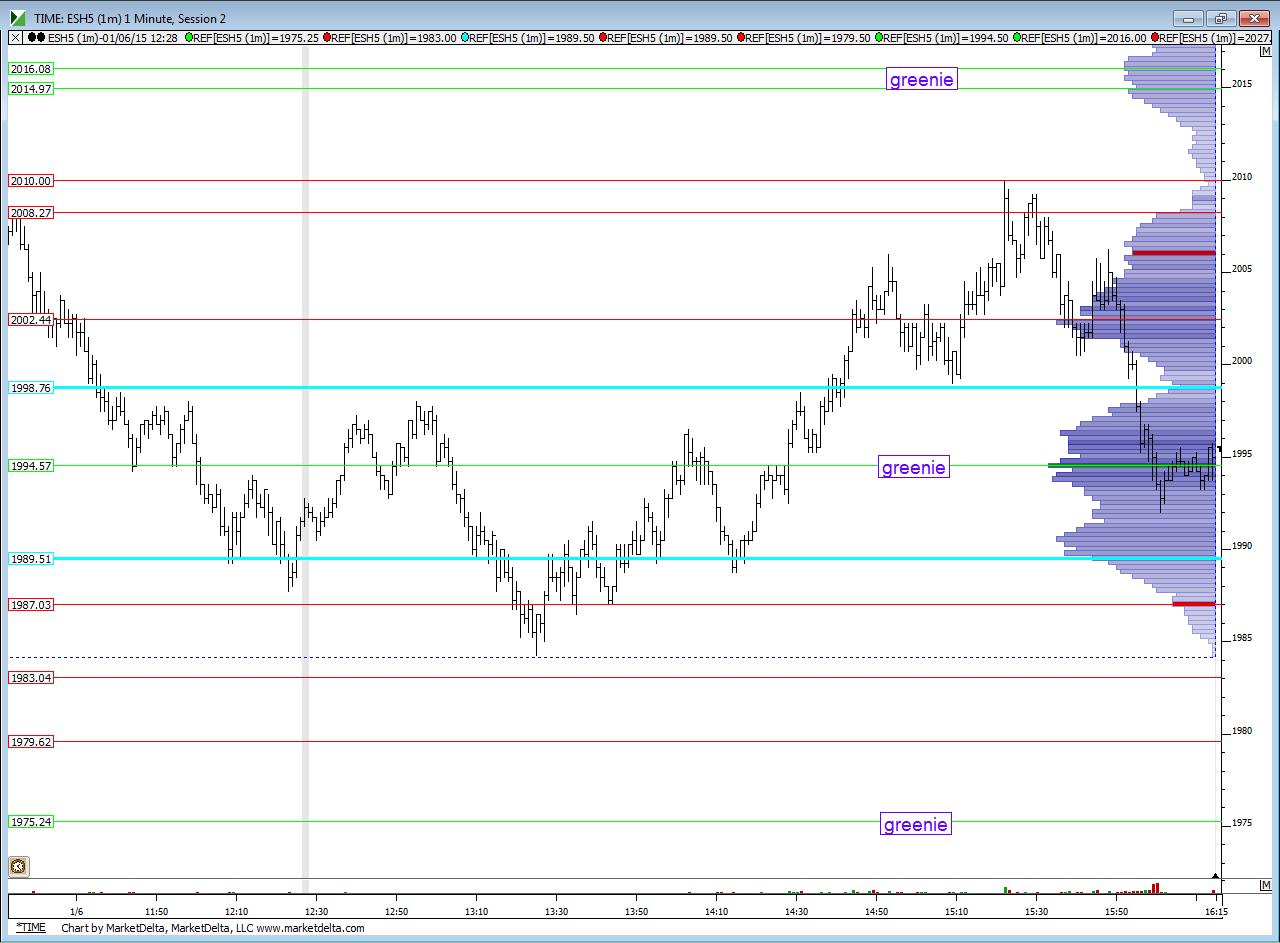
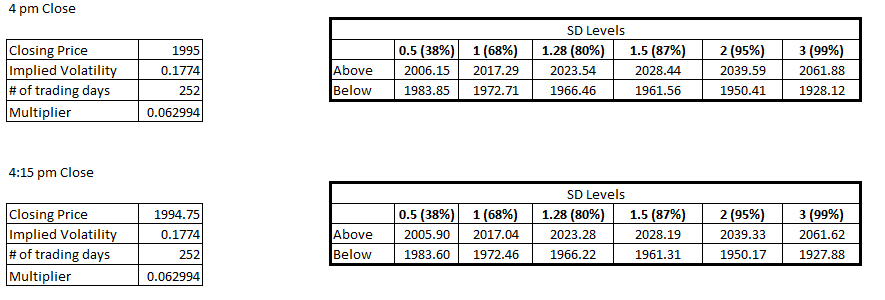
Bands for 1/7. YD we hit the 1.28 SD band number (80%) so lets see what today brings us.
Bruce, I have noticed that you have mentioned the SD bands for 365 days a few times. Have you changed your opinion and are looking at 365 days? Curious to know what you have seen. Thanks.
Bruce, I have noticed that you have mentioned the SD bands for 365 days a few times. Have you changed your opinion and are looking at 365 days? Curious to know what you have seen. Thanks.
Click image for original size
here is my chart. i promise i did not cheat :)
Click image for original size
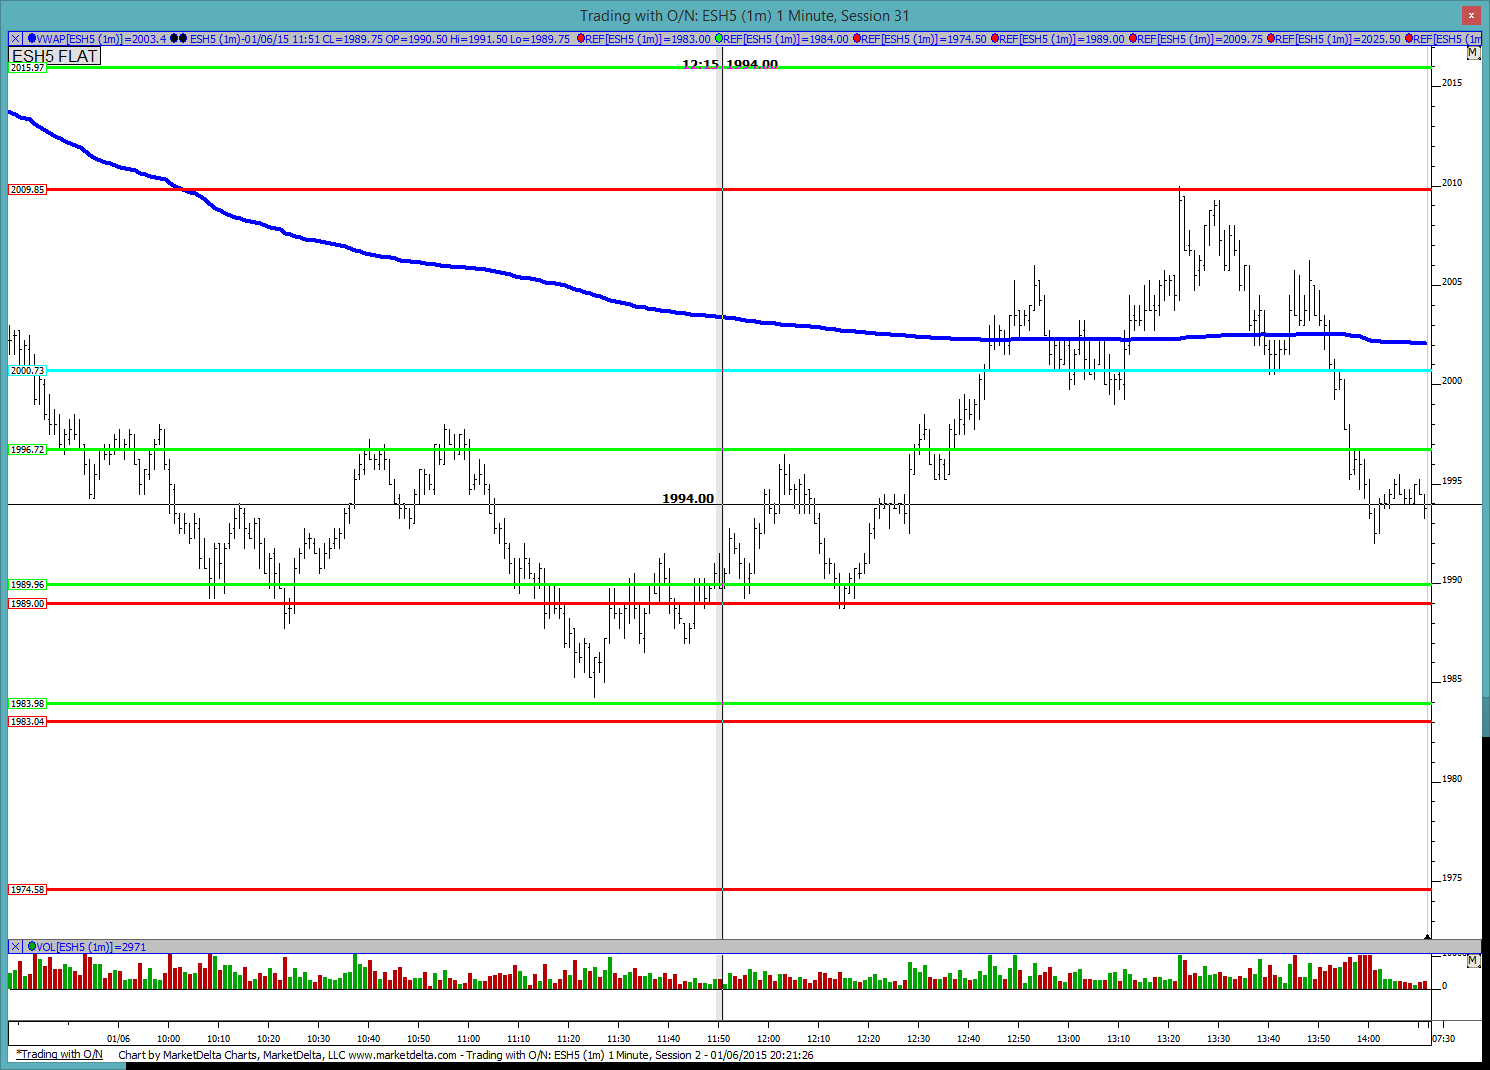
that's great new kid.....I think you have the lines just right.......regarding the bands, I keep reading both sides of the story regarding the bands and which number of days to use so I have decided that I am going to stick with Haggertys original 4 pm close ( as he used the spx to calculate the bands) of the Es and 365 days. The more I research the options and look at the options SOFTWARE , I realize that the software all seems to use 365 days.........so for those reasons I had to choose one in order to not drive myself crazy with too many difference in data........
In general the bands are more of a guideline so while they are important I always need to match it up with something else anyway. I also seem to trade less and less past 11 a.m and most trend days don't hit the bands until after that time.....except on big up or down gap openings then they can help me out a bit. Often you will find one method of calculation overlaps with another...for example a 252 calculation may hit it's 1.28 while the 365 is hitting it's 1 SD band.....
I enjoyed your post the other night regarding your JOURNEY.......thanks for putting that out there!!
thank you for the kind words Bruce. good luck today
I updated post one above just now for those interested......R1 is 2017 today and the Pivot is 2001.....at least one of those will print today but could happen post fed report
considering starting some shorts around 10 to get the O/N mid pt
one last point I will be watching closely is that 7:30 swing low/ledge...just in case...If I see them take that out and I see a slow down/ selling dry up they I will look at that to get long...so I am adding 2006 into the mix and will see what the Pitbull numbers say if they push that out....the point of reposting the Overnight data is to confirm the day session levels.....most who have been here a while know that but worth repeating for anybody new...
agreed. that 2006 level sure looks interesting...
it sure seems like that 8- 10 is gonna be the magnet so I would like to see it above there to initiate any shorts so we can take something off in there as a target first...so the 11.50- 12 area is probably a better gamble if one was trading post 9 a.m....that would also split our 10 number with the 15 number above...so the 50 % mark of our key zones
Originally posted by NewKid
considering starting some shorts around 10 to get the O/N mid pt
good call on the 11.5 to 12 Bruce. I did not get the 6 and was stopped out but good call on your part. will try again from higher up
Yup, they sure got that area real fast. I guess that was all the pent up frustration from lack of action post fomc!
Emini Day Trading /
Daily Notes /
Forecast /
Economic Events /
Search /
Terms and Conditions /
Disclaimer /
Books /
Online Books /
Site Map /
Contact /
Privacy Policy /
Links /
About /
Day Trading Forum /
Investment Calculators /
Pivot Point Calculator /
Market Profile Generator /
Fibonacci Calculator /
Mailing List /
Advertise Here /
Articles /
Financial Terms /
Brokers /
Software /
Holidays /
Stock Split Calendar /
Mortgage Calculator /
Donate
Copyright © 2004-2023, MyPivots. All rights reserved.
Copyright © 2004-2023, MyPivots. All rights reserved.