ES Friday 3-13-15
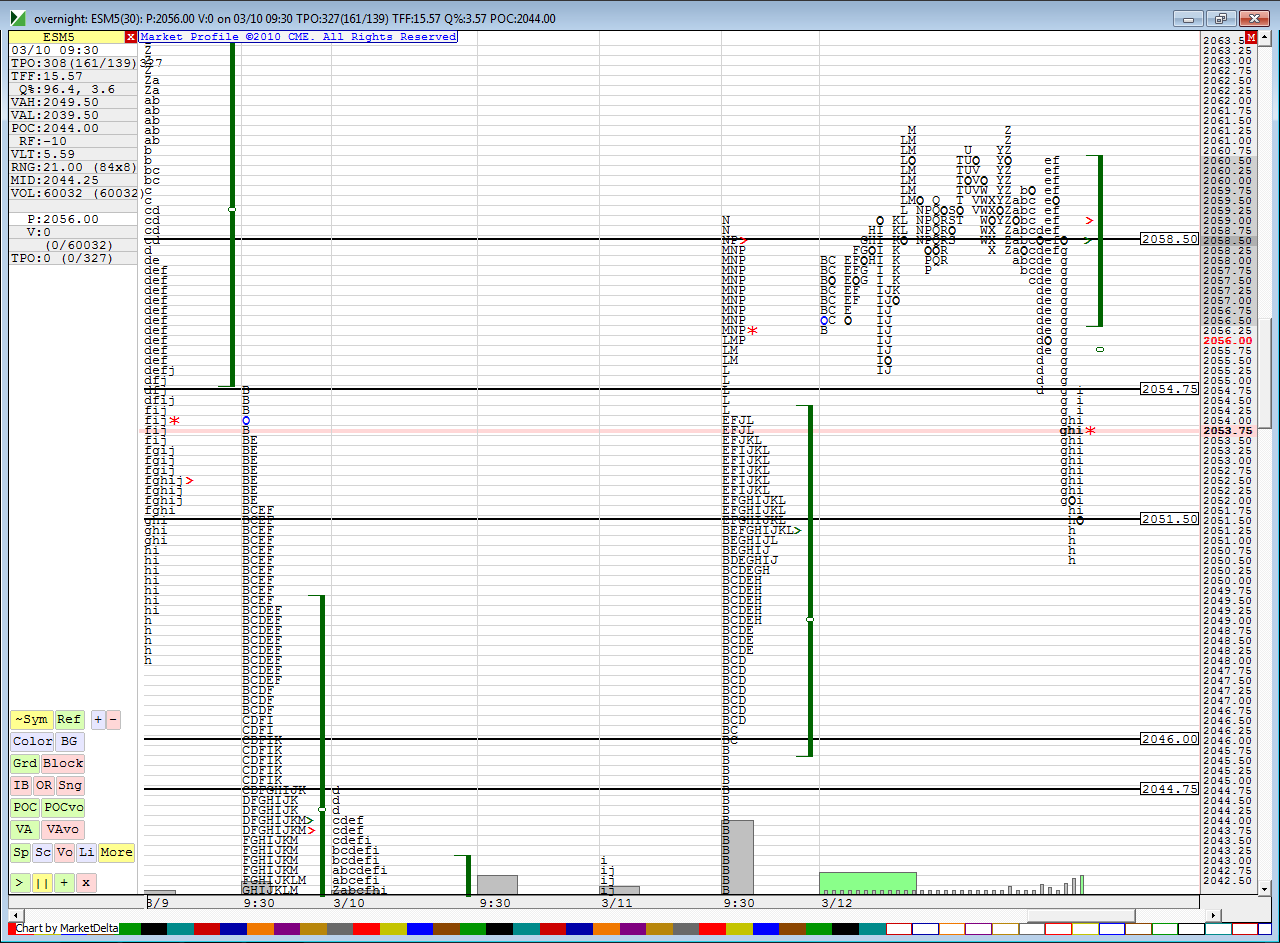
Buying into 52 now....targeting 54.25...No midpoint test yesterday from O/N ...51 - 52 has poc and Pivot
here are my quick key lines this morning
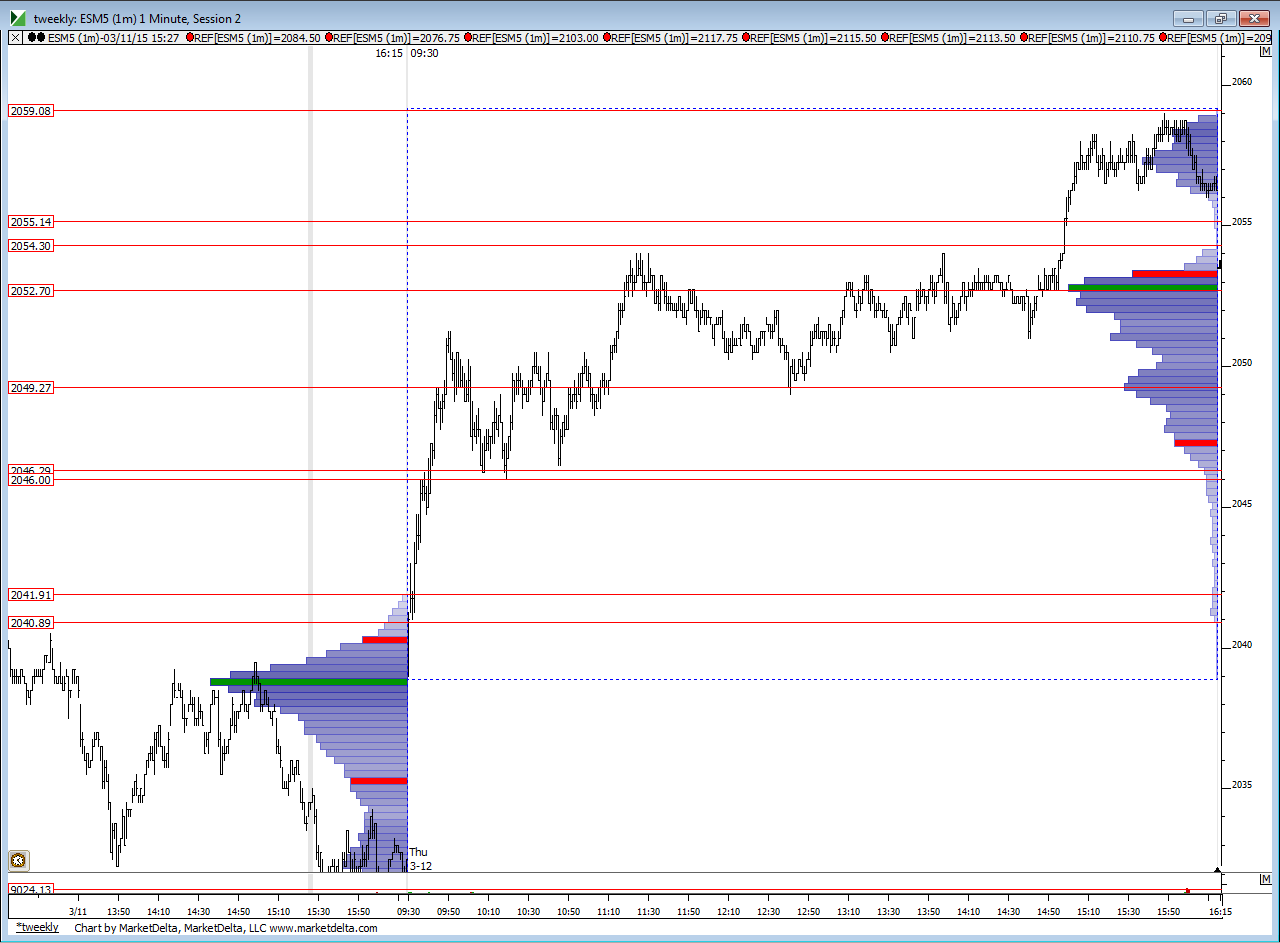
here's another view based on one minute time
here are my quick key lines this morning
Click image for original size
here's another view based on one minute time
Click image for original size
coming out heavy one 2 tic in front of midpoint.....also took a target at 52.50 on the way back up off off the 49 trade.......my second 54 buys in On lost when we took out One minute low...decided not to add in on that trade as I'm trying to remember to just take the loser and try again......last coming out as I type at gap close..that's it for me today;
another reason I go market.......seems best to give up a tic or two to gain 4- 5 points some days
Originally posted by NewKid
had an order at 49.25, it touched it, i did not get a fill and now we are back up...
yeah i can see that...i lost out on a good 4 point trade because i could not get filled. it dropped there so fast but you are right, i should have gone market. i am trying to do that but having some trouble with it. i need to learn to do that. anyways, great trading as always Bruce. the lines (think we had the same) played out beautifully today
nice minus 4 hit today....The idea of the plus and minus 4- 5.5 and the plus/minus 8 - 10 seems to working for many lately
I was hell bent on that midpoint......I'm off to get my 13 year old out on the slopes and beat myself up a bit stumbling down the mountain...I have lots to learn ....c ya and hope all enjoy the weekend
Originally posted by NewKid
yeah i can see that...i lost out on a good 4 point trade because i could not get filled. it dropped there so fast but you are right, i should have gone market. i am trying to do that but having some trouble with it. i need to learn to do that. anyways, great trading as always Bruce. the lines (think we had the same) played out beautifully today
enjoy skiing and your weekend too
Have fun Bruce...break a leg...or don't break a leg..never sure on where to use that saying :-)
Nasdaq daily resting on the 55ema....longs be cautious
Click image for original size
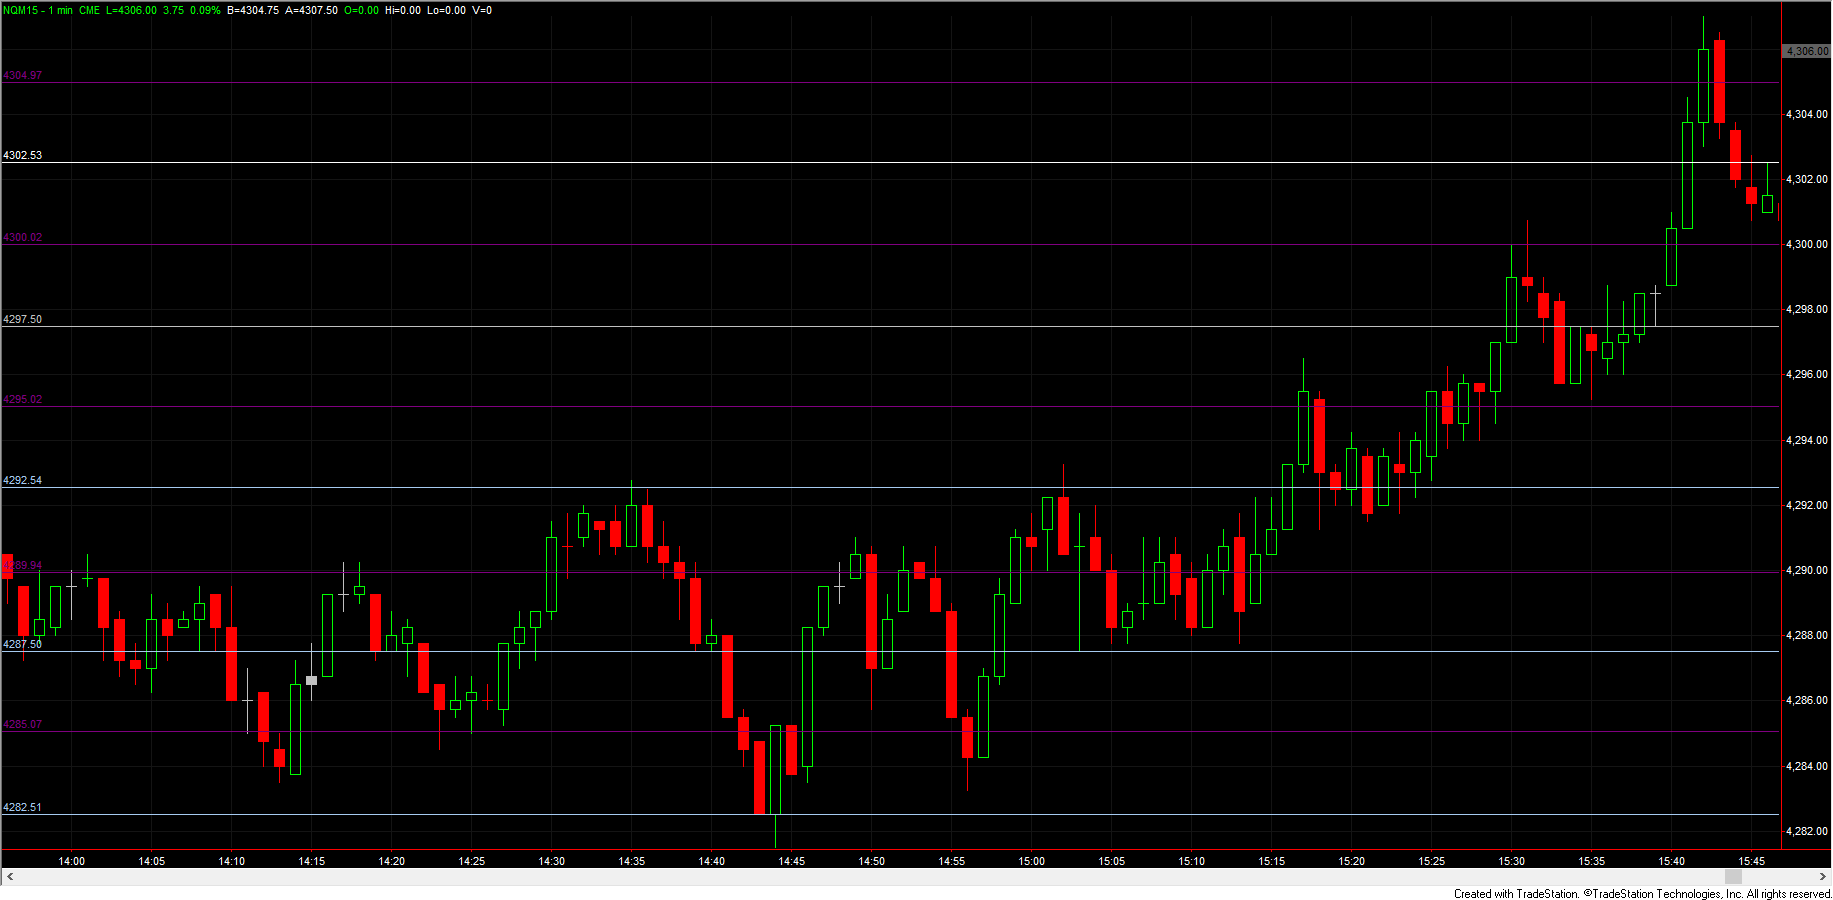
Haha there we go, I got a chart up. This is a one min chart of the Nq in late Friday trading. The lines you are looking at are not support and resistance horizontal lines like floor trader pivots or prime numbers these are in purple every 5pts and in white every 2.5 if price closes above/below a new level a trade will be taken in that direction as per your larger time frame analysis. Just let your eyes roam on the action and observe potential areas of entry and exit. No indicators, it doesn't matter if earnings are good, bad, new highs or lows. all that matters is price movement and a little higher time frame judgment.
Great stuff Joe. Thanks for sharing!
Emini Day Trading /
Daily Notes /
Forecast /
Economic Events /
Search /
Terms and Conditions /
Disclaimer /
Books /
Online Books /
Site Map /
Contact /
Privacy Policy /
Links /
About /
Day Trading Forum /
Investment Calculators /
Pivot Point Calculator /
Market Profile Generator /
Fibonacci Calculator /
Mailing List /
Advertise Here /
Articles /
Financial Terms /
Brokers /
Software /
Holidays /
Stock Split Calendar /
Mortgage Calculator /
Donate
Copyright © 2004-2023, MyPivots. All rights reserved.
Copyright © 2004-2023, MyPivots. All rights reserved.