ES Friday 7-31-15
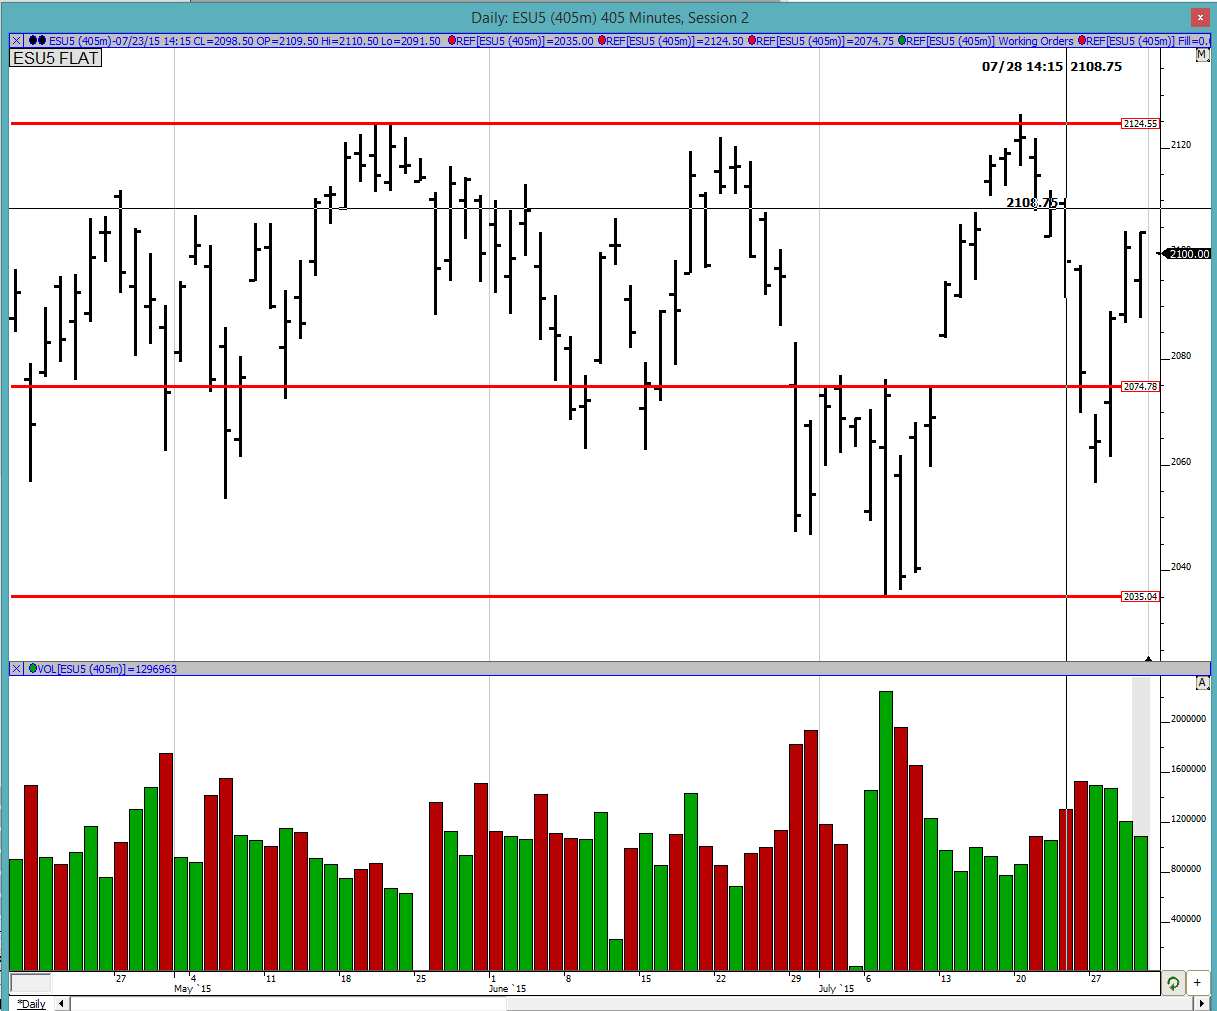
Good morning to all. As seen in the chart below, Thursday was an inside day with the the high of the day just 1 tick shy of Thursday's high and the low being 4 ticks shy of Thursday's low. This indicates a fairly indecisive market which could not even breakthrough either end of the range. Today could potentially be a range breakout day or a look outside range and fail trade. This is going to be tricky because I am not the best at executing this so I will have to be extra alert.
Greenies: 2123.5, 2118.75, 2112.75, 2108.25, 2100, 2091 and 2066.75
Profile:
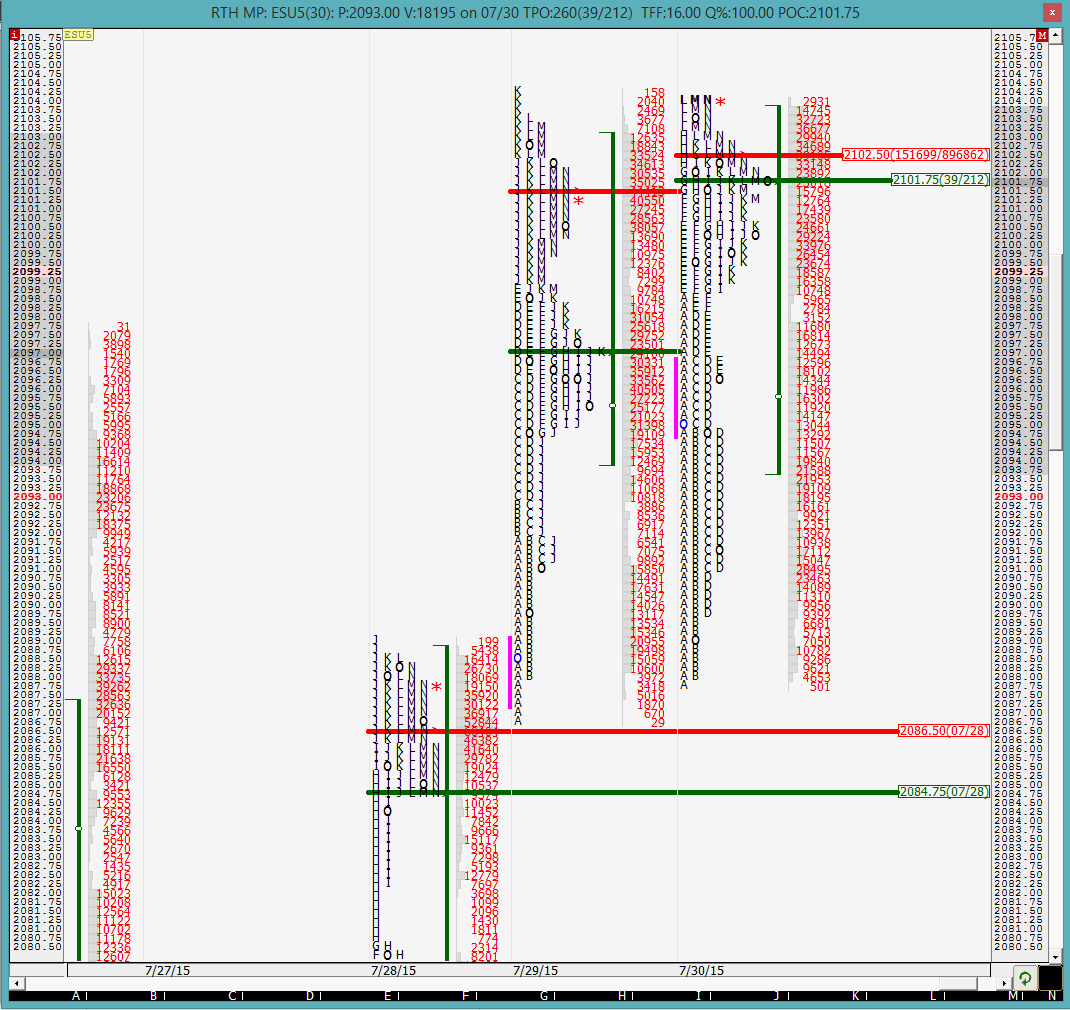
The MP chart almost looks like P pattern but the top is not quite rounded and the stem is not as skinny. There is absolutely no excess at the top with 3 TPOs wide at high of the day. When we combine that with Thursday's high being just 1 tick above this, it implies that the auction is most likely not complete up there and it needs to be cleaned up. That could mean a run through it and then a collapse or just straight back up. The markets have been quite wacky of late with straight up and straight down movements so one does not know. We will need to have good reflexes. The VPOC and POC both were on the upper end of the distribution which indicates bullish action.
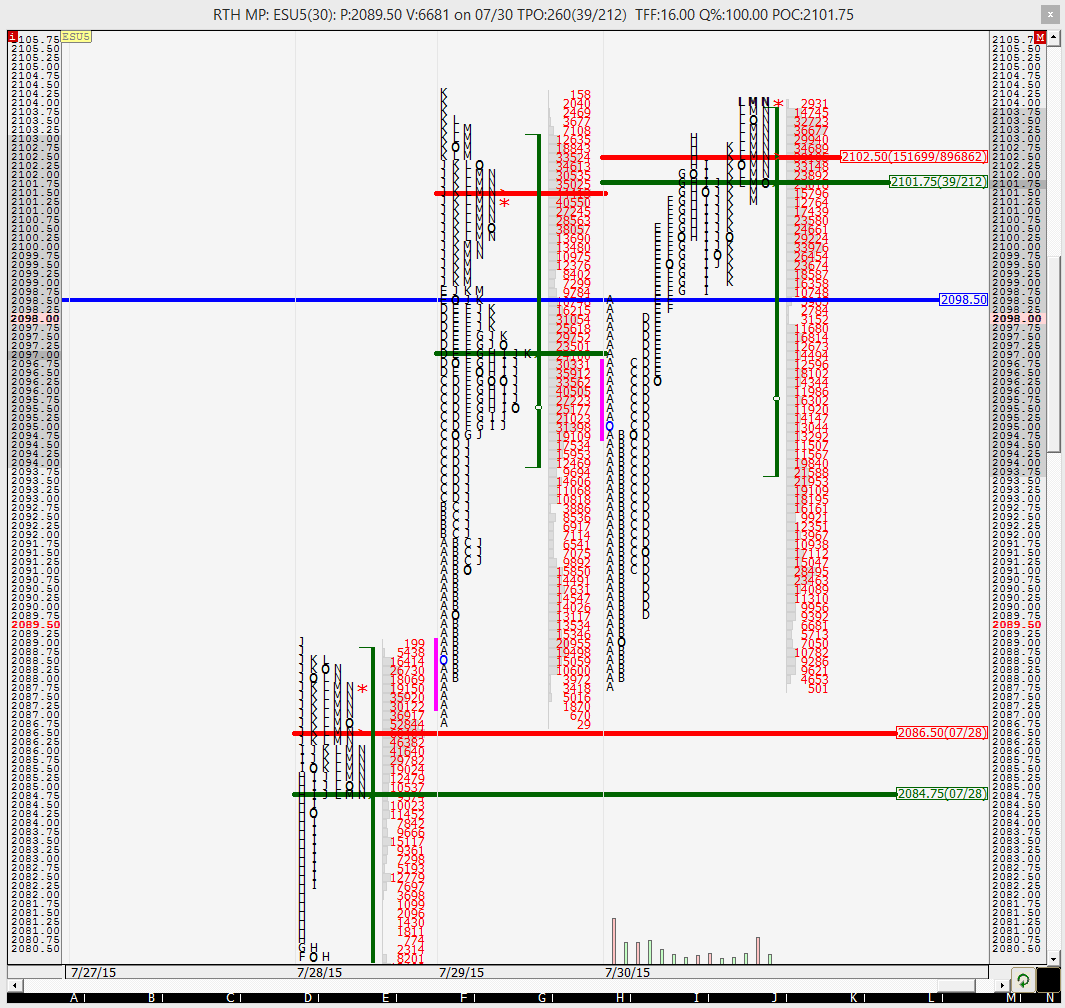
Looking at the split profile it looks like the A period high, which was the high of the day earlier in the day, became support later in the day. We can see that in G, I and K periods buyers came in to defend this level. So that is something that is going to be on my radar. But really it is the range breakout or fake that are going to give the best possible opportunities.
The O/N inventory seems fairly balanced so not placing too much emphasis on that. Current O/N high is 2107, which is higher than YD's RTH high and the market is hovering around the current ONL around the 2098.5 pull back level. I believe patience is going to be the key today to let the trade come to you rather than rush into anything.
Good luck to all.
Greenies: 2123.5, 2118.75, 2112.75, 2108.25, 2100, 2091 and 2066.75
Click image for original size
Profile:
The MP chart almost looks like P pattern but the top is not quite rounded and the stem is not as skinny. There is absolutely no excess at the top with 3 TPOs wide at high of the day. When we combine that with Thursday's high being just 1 tick above this, it implies that the auction is most likely not complete up there and it needs to be cleaned up. That could mean a run through it and then a collapse or just straight back up. The markets have been quite wacky of late with straight up and straight down movements so one does not know. We will need to have good reflexes. The VPOC and POC both were on the upper end of the distribution which indicates bullish action.
Click image for original size
Looking at the split profile it looks like the A period high, which was the high of the day earlier in the day, became support later in the day. We can see that in G, I and K periods buyers came in to defend this level. So that is something that is going to be on my radar. But really it is the range breakout or fake that are going to give the best possible opportunities.
Click image for original size
The O/N inventory seems fairly balanced so not placing too much emphasis on that. Current O/N high is 2107, which is higher than YD's RTH high and the market is hovering around the current ONL around the 2098.5 pull back level. I believe patience is going to be the key today to let the trade come to you rather than rush into anything.
Good luck to all.
The O/N market just snapped back quite quickly from the 98 region back to the developing O/N VPOC of 2103. Too bad I try not to trade O/N....
the market opened outside of YD's range and has immediately dropped back into range. is it just probing to see if there is anything left and will buyers be back or are we going to test the other extreme?
Seeing a bounce so far off of that 98.5 pullback level mentioned so far
I have the O/N low at 2097.75
Looks like the 2100 area was a support zone. A break out point from the overnight move down and yesterday VPOC was near by.
sharks, yes I have the O/N low at 2097.75. The 2098.5 I mentioned was YD's pull back low. And 2101 was a greenie on my screen so it did manifest itself as support
Good morning
thx. for your work here , here is my perspective for today and daily key is the important point wher the Trend is definied, 2105 was Meanline overnightrading....sorry my english is bad but i hope its clear and may be it helps ;)
wr1, mr1 are monthly R1 and so on from Pivotlevels as you can see 2074 is monthly PP and we are above weekly and monthly PP and so on ...no idea how to post the Chart directly here so i used these:
hi zodei1, thanks for posting. what do you mean by meanline? how do you draw that?
Its like a Roadmap for me and I took now 2nd time a LONG (CFDs not Futures) countertrend and hope we go above these daily key and MoB Point that would be bullish Trend...ok and thx again for all the stuff here from your guys that is read nearly daily , great stuff to learn daily and i hope Bruce will come again

thanks for that.
we are getting out of YD's range again. Is this going to be a true breakout to 2108.25 and 2112.75 greenies?
we are getting out of YD's range again. Is this going to be a true breakout to 2108.25 and 2112.75 greenies?
the market is struggling to break out of range....
Emini Day Trading /
Daily Notes /
Forecast /
Economic Events /
Search /
Terms and Conditions /
Disclaimer /
Books /
Online Books /
Site Map /
Contact /
Privacy Policy /
Links /
About /
Day Trading Forum /
Investment Calculators /
Pivot Point Calculator /
Market Profile Generator /
Fibonacci Calculator /
Mailing List /
Advertise Here /
Articles /
Financial Terms /
Brokers /
Software /
Holidays /
Stock Split Calendar /
Mortgage Calculator /
Donate
Copyright © 2004-2023, MyPivots. All rights reserved.
Copyright © 2004-2023, MyPivots. All rights reserved.