ES Friday 10-7-16
a look at the coil on the daily chart...this is all session...I plan on making a video ( with real sound) post 8:30 reports and will edit this post but please don't let that stop others from posting all the cool charts and things we've been seeing....it's all good to me... a very big move should be coming soon....this can't last forever....which way ? I have no idea
Click image for original size
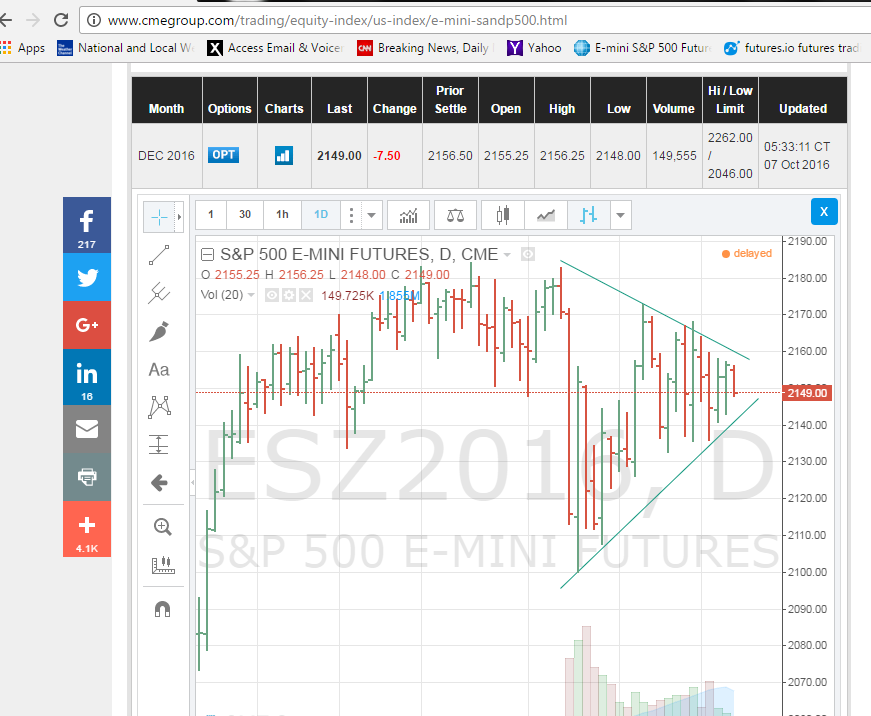
Nice chart Bruce..I've been watching this wedge form for days now and your right I have no clue which way it will break out.
I wonder if the employment numbers today will give us a TELL?
sharks
I wonder if the employment numbers today will give us a TELL?
sharks
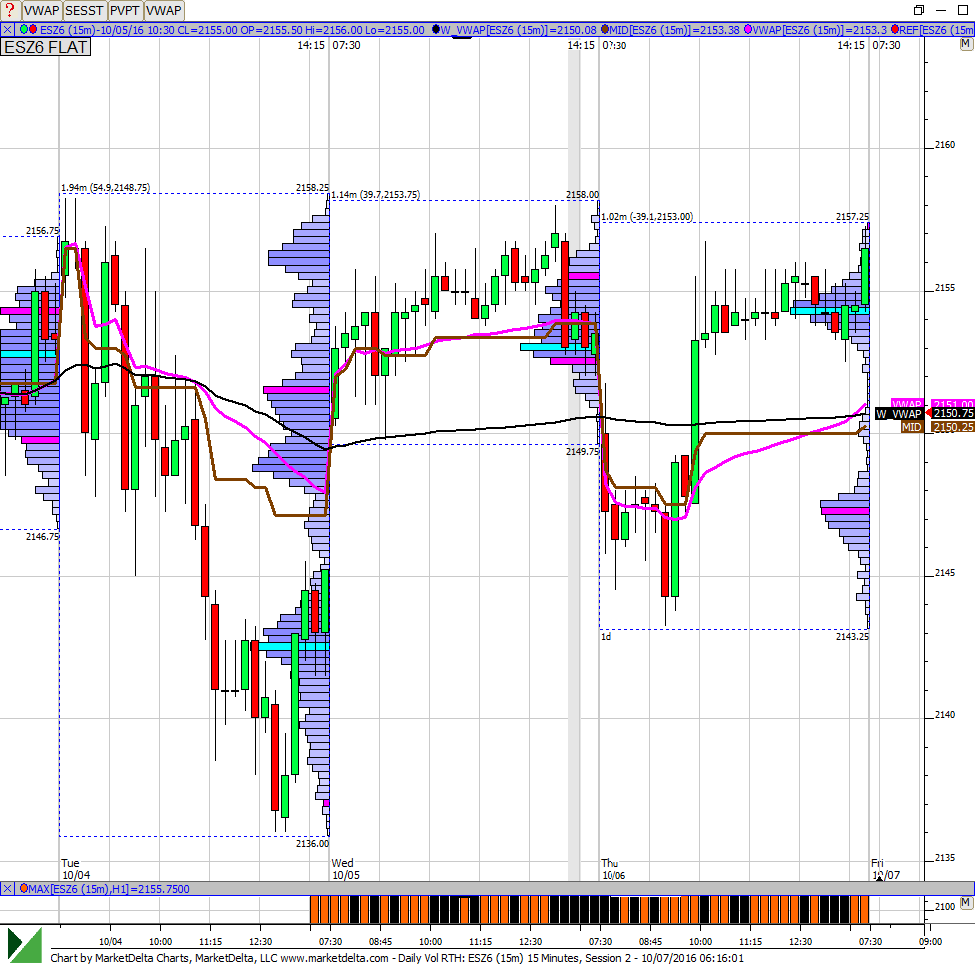
To reinforce the point that Bruce and sharks made, here is a weekly profile chart. We continue coiling and like everyone else has said, that is bound to break. My guess is that a higher likelyhood to the upside than downside but it is still a guess. Waiting for price action before making any move. Keep in mind that today not only do we have the NFP numbers but also a bunch of FOMC members are speaking again. Wild swings could be possible.
Big Mike, you asked about the 1M OR breakout. I personally do not use the 1M but I use 5M OR. That is illustrated by the red lines in the chart below. As can be seen, first we were below the OR and consolidated there. Upon news we jumped up above the OR and consolidated there. And right now in ON, we are trading in the middle in the LVN zone. Really indecisive market right now.
Another chart showing the volume profile where the thinness of the profile can be seen in the middle
Click image for original size

Big Mike, you asked about the 1M OR breakout. I personally do not use the 1M but I use 5M OR. That is illustrated by the red lines in the chart below. As can be seen, first we were below the OR and consolidated there. Upon news we jumped up above the OR and consolidated there. And right now in ON, we are trading in the middle in the LVN zone. Really indecisive market right now.
Click image for original size
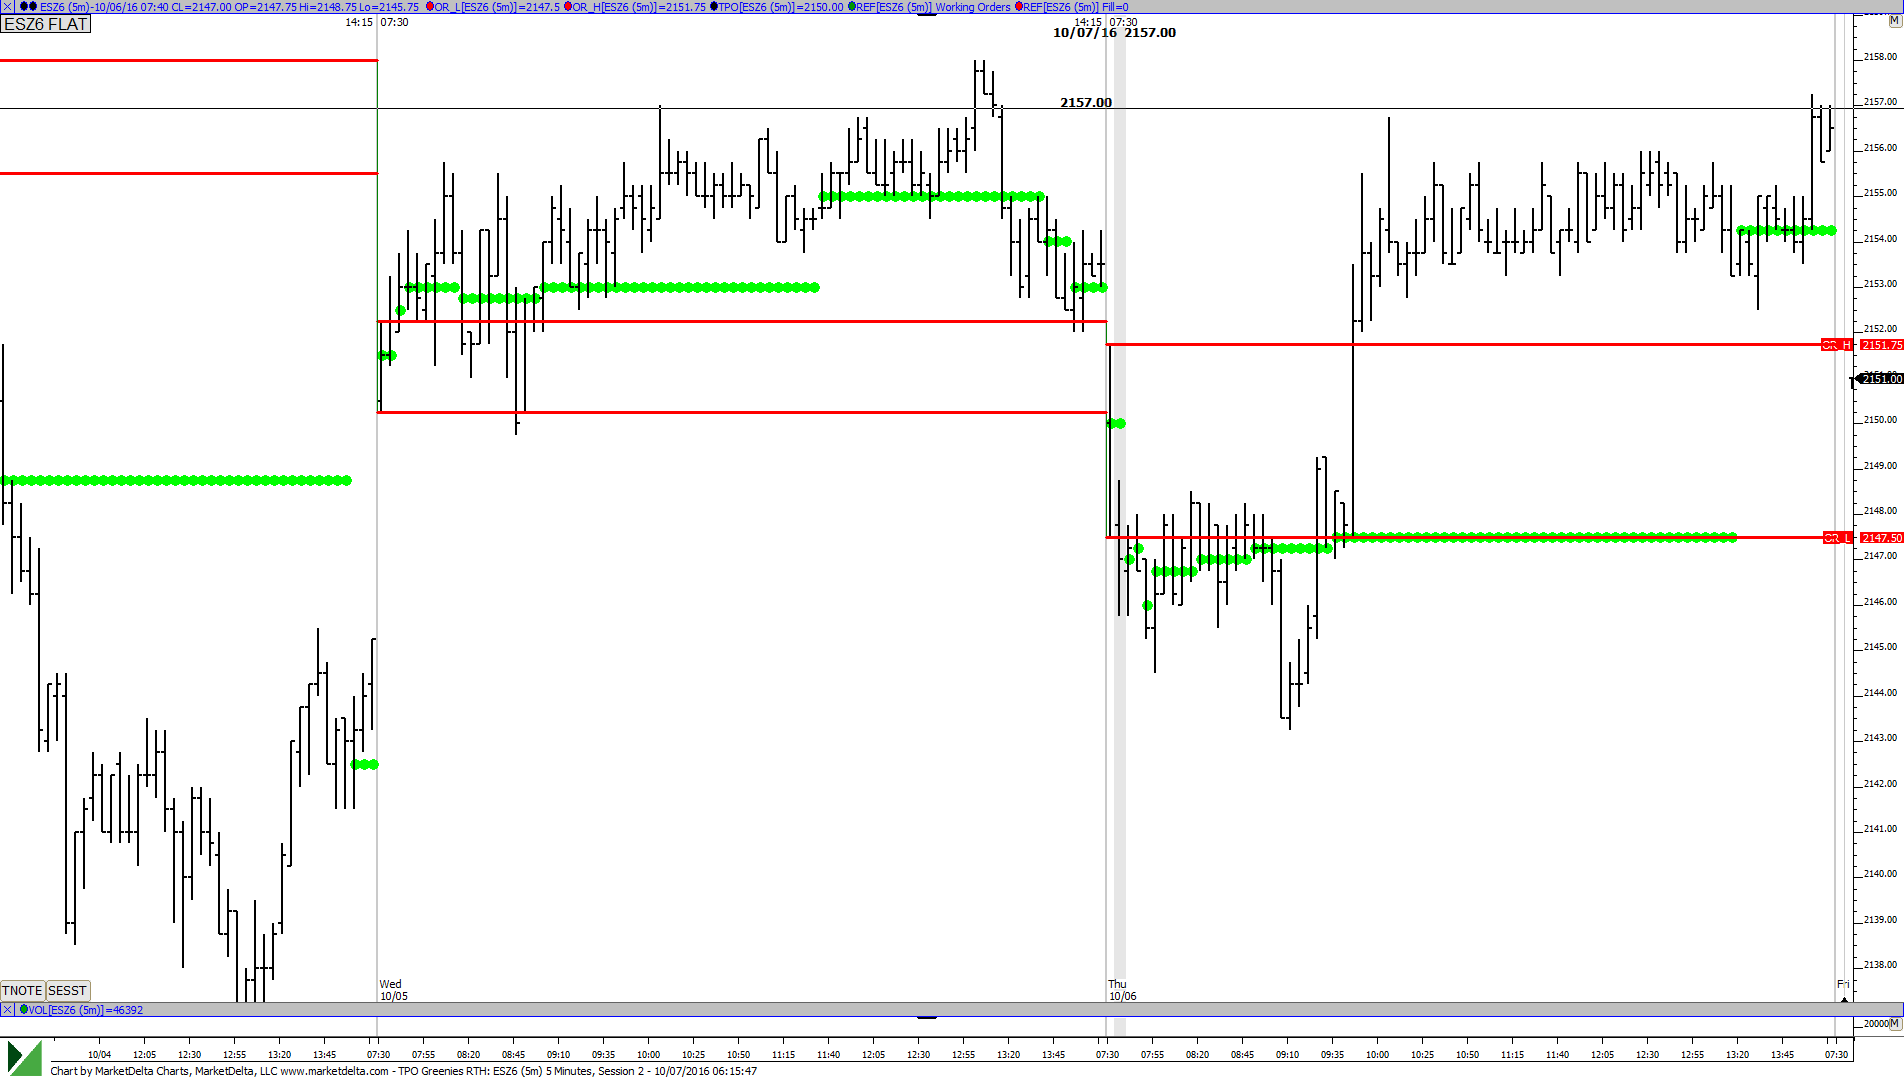
Another chart showing the volume profile where the thinness of the profile can be seen in the middle
Click image for original size
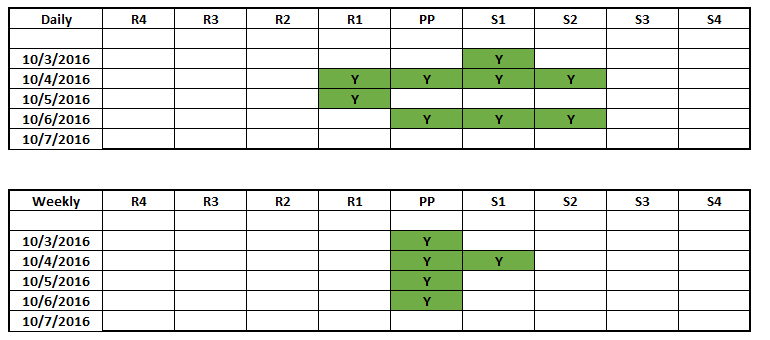
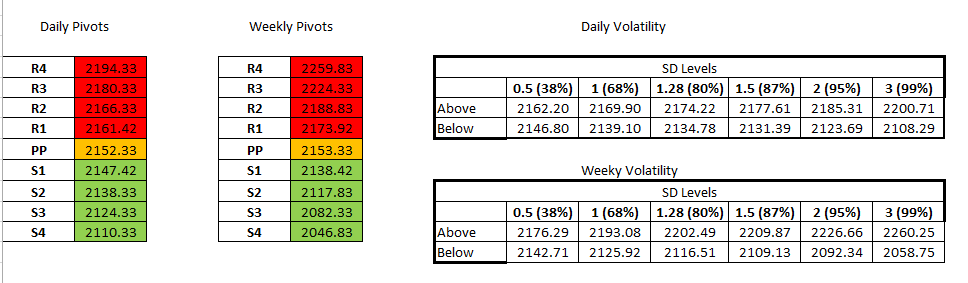
Here is the current scorecard and today's floor numbers with SD bands
Click image for original size
Click image for original size
Bruce, did you end up trading the report? I sat it out. Those were some wild swings. A short from the 60.25 naked POC would have worked in hindsight but it was too risky for me to take it
no...I rarely trade reports but I still have options to unwind for better or worse.......going to dig deeper into the charts now
Originally posted by NewKid
Bruce, did you end up trading the report? I sat it out. Those were some wild swings. A short from the 60.25 naked POC would have worked in hindsight but it was too risky for me to take it
I'm thinking about trying to get short for current midpoint retest
basically just splitting up the three key areas and those to me are 58 - 59, 62 and 52.50 - 54 on downside...the 58 - 59 holds the key in early trade to me...video ramble for those who want to kill time....see the ad line with bollingers and a gap in Overnight data
Jing cut me off for talking too much...ha !!
Jing cut me off for talking too much...ha !!
good video Bruce. thanks for that. lines up with most of my lines as well. audio was good today.
New Kid - you have gaps in your data where none exist on two different feeds...look at your Low on Wednesday....it shows a gap...I don't have that on IB or more importantly my TOS data...what feed r u using?
thanks...different computer.....
Originally posted by NewKid
good video Bruce. thanks for that. lines up with most of my lines as well. audio was good today.
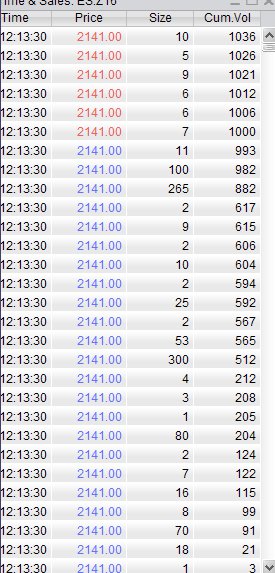
a little late and after the fact now but still an example
Click image for original size
Emini Day Trading /
Daily Notes /
Forecast /
Economic Events /
Search /
Terms and Conditions /
Disclaimer /
Books /
Online Books /
Site Map /
Contact /
Privacy Policy /
Links /
About /
Day Trading Forum /
Investment Calculators /
Pivot Point Calculator /
Market Profile Generator /
Fibonacci Calculator /
Mailing List /
Advertise Here /
Articles /
Financial Terms /
Brokers /
Software /
Holidays /
Stock Split Calendar /
Mortgage Calculator /
Donate
Copyright © 2004-2023, MyPivots. All rights reserved.
Copyright © 2004-2023, MyPivots. All rights reserved.