Long-term and Short-term Setups
Hello Traders,
I’m a pro with 7+ years of experience in the market. I want to help out retail traders. So, here I post some of my long-term and short-term setups and crisp points of the reasoning and my conclusion. Hope it benefits you.
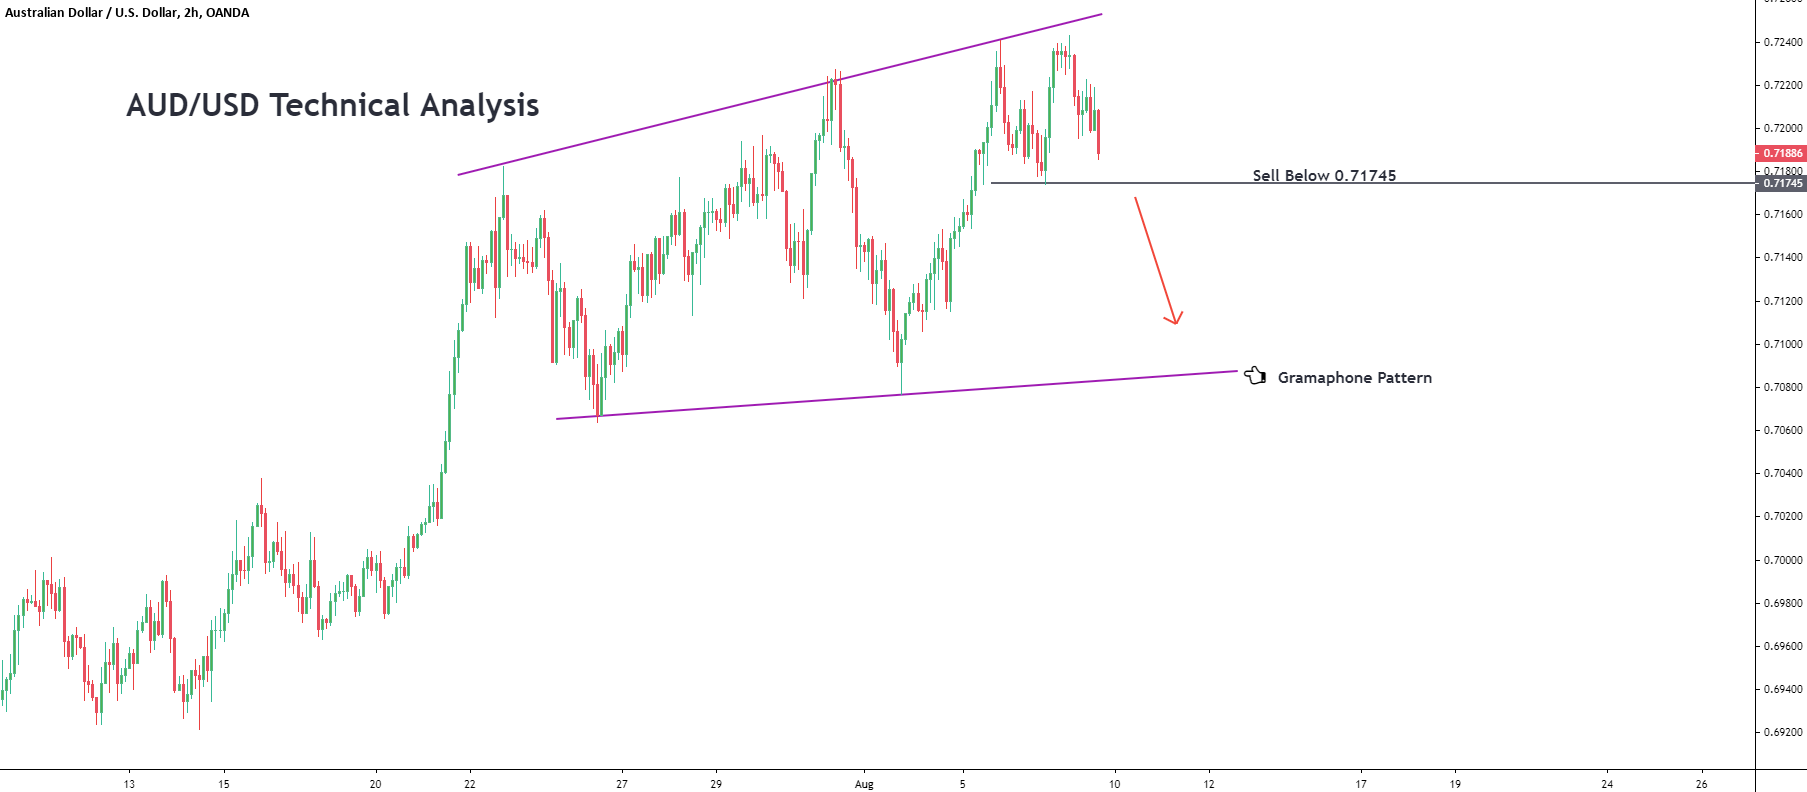
AUD/USD Technical Analysis
~~ The counter has formed a gramophone pattern.
~~ It has hit the upper trendline and is coming down with strong momentum.
~~ We advise traders to go short when the pair breaks the support level of 0.71745 and expect a sell-off to lower trendline.
I’m a pro with 7+ years of experience in the market. I want to help out retail traders. So, here I post some of my long-term and short-term setups and crisp points of the reasoning and my conclusion. Hope it benefits you.
AUD/USD Technical Analysis
~~ The counter has formed a gramophone pattern.
~~ It has hit the upper trendline and is coming down with strong momentum.
~~ We advise traders to go short when the pair breaks the support level of 0.71745 and expect a sell-off to lower trendline.
Click image for original size
AUD/JPY Technical Analysis
~~ AUD/JPY has bounced off from a supportive trendline.
~~ However, the recent fall has depleted the bullish momentum in the counter its now in a rising wedge formation.
~~ We expect the pair to move to trade with bullish bias.
~~ AUD/JPY has bounced off from a supportive trendline.
~~ However, the recent fall has depleted the bullish momentum in the counter its now in a rising wedge formation.
~~ We expect the pair to move to trade with bullish bias.
Click image for original size

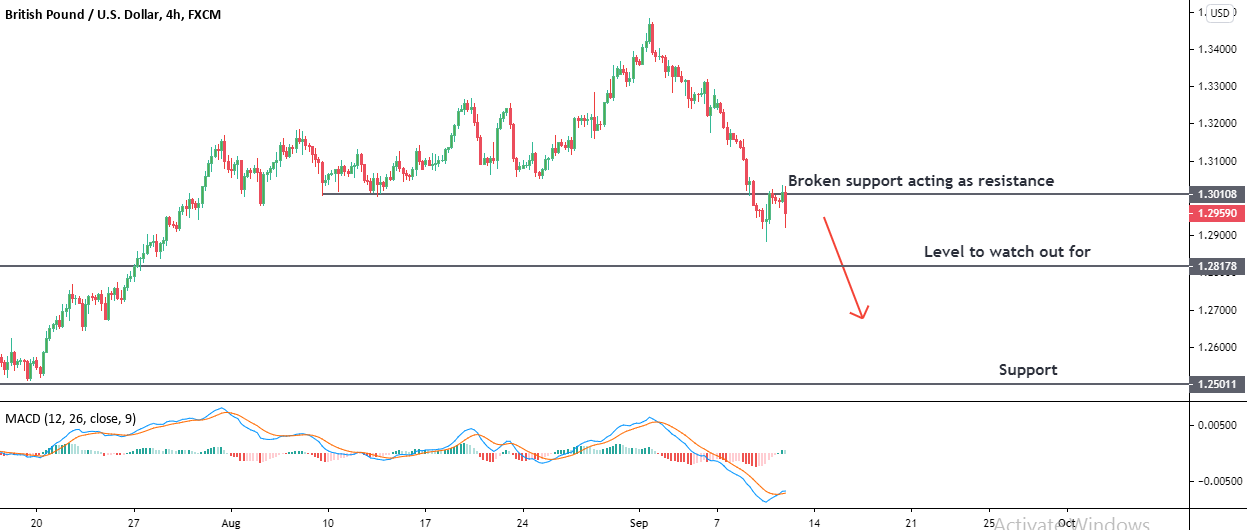
GBP/USD Technical Analysis
~~ The counter's dynamics have changed drastically this week.
~~ It turned bearish abruptly due to the risk of no-deal Brexit.
~~ And there has been a significant amount of longs trapped.
~~ It broke the support of 1.30100 which is now capping the rally.
~~ We expect the pair to move down significantly as long as the pair stays below this level.
Click image for original size
NZD/JPY Technical Analysis
~~ The zone of 71.100-200 proves to be a tough nut for the pair.
~~ Despite multiple attempts, the price is unable to break above it.
~~ Further, the price action has formed an evening action star pattern at the resistance zone.
~~ Hence, we expect the pair to be bearish in the near-term.
~~ The zone of 71.100-200 proves to be a tough nut for the pair.
~~ Despite multiple attempts, the price is unable to break above it.
~~ Further, the price action has formed an evening action star pattern at the resistance zone.
~~ Hence, we expect the pair to be bearish in the near-term.
Click image for original size

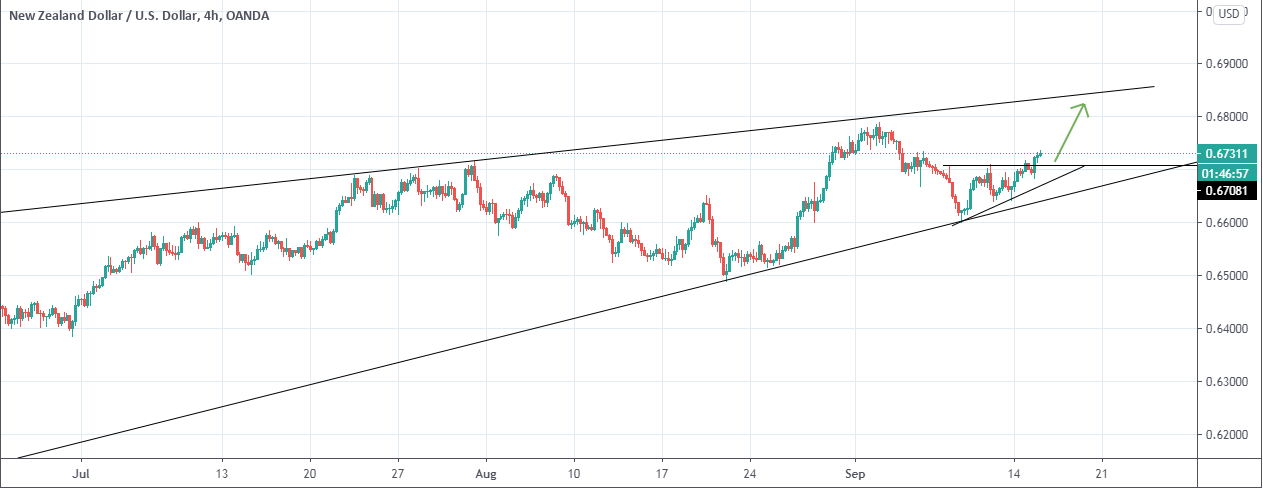
NZD/USD Technical Analysis
~~ This counter currently trying to form a wedge formation.
~~ Now, it has formed an ascending triangle with in that & broken to move up further.
~~ Hence, we expect that it will be bullish upto the resistance line.
~~ This counter currently trying to form a wedge formation.
~~ Now, it has formed an ascending triangle with in that & broken to move up further.
~~ Hence, we expect that it will be bullish upto the resistance line.
Click image for original size
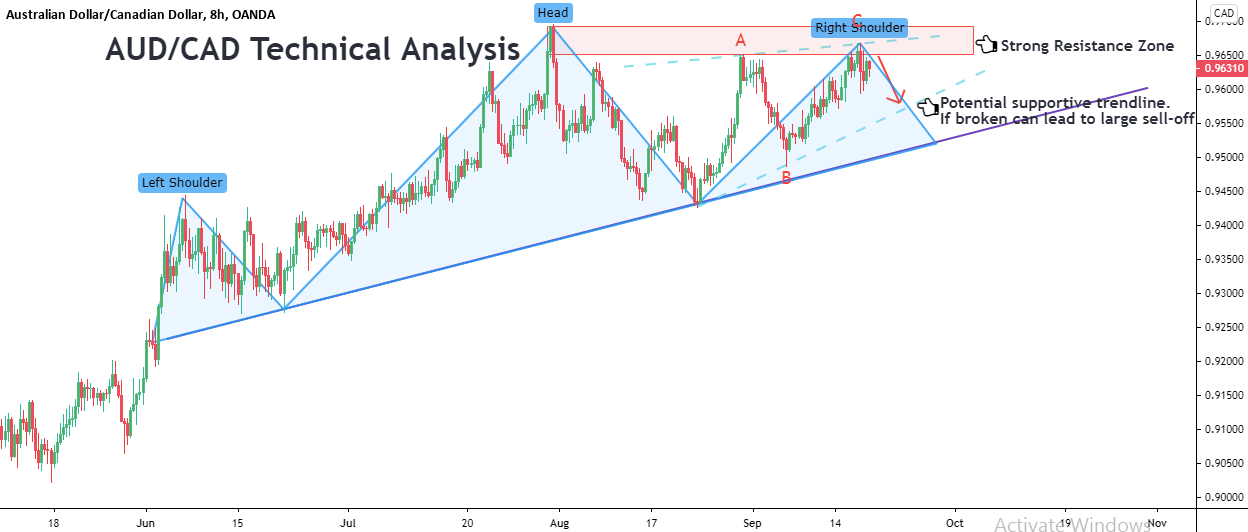
AUD/CAD Technical Analysis
~~ The counter is currently trading around a strong resistance zone that triggered a sell-off previously.
~~ According to the wave, it has now completed the ABC correction for the down move it made.
~~ Further, the entire setup looks like a head and shoulder in the higher timeframes.
~~ Hence, we expect the pair to move down from here to the potential supportive trendline marked in the chart and if it is broken, it could trigger a larger sell-off.
Click image for original size
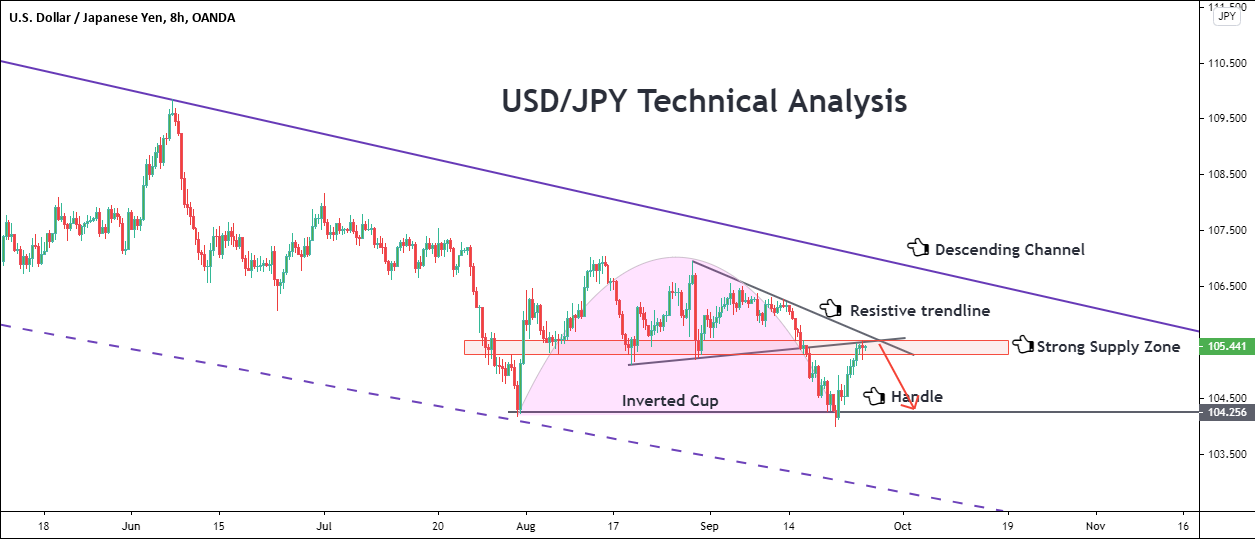
USD/JPY Technical Analysis
~~ The counter is currently in a descending channel formation.
~~ It has made an inverted and cup and handle formation within that.
~~ Further, the price is currently hovering around a strong supply zone.
~~ Hence, we expect the pair to be bearish in the short-term.
~~ The counter is currently in a descending channel formation.
~~ It has made an inverted and cup and handle formation within that.
~~ Further, the price is currently hovering around a strong supply zone.
~~ Hence, we expect the pair to be bearish in the short-term.
Click image for original size
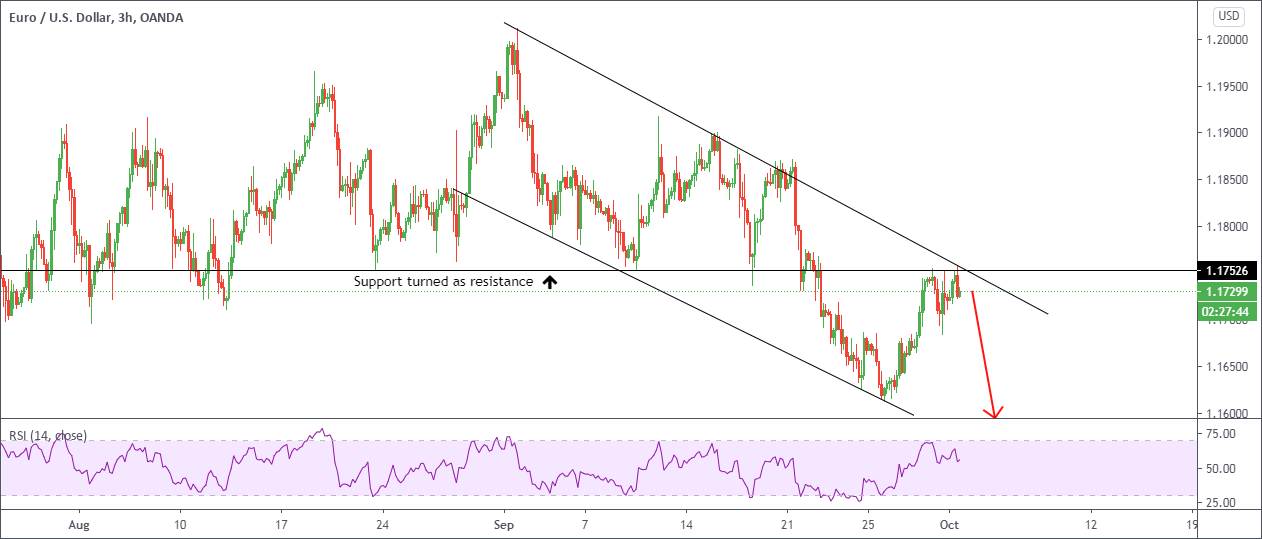
EUR/USD Technical Analysis
~~ This counter has formed a descending channel formation.
~~ It has taken the strong support as resistance & bounce back in downward direction.
~~ Hence, it will be bearish from here.
~~ This counter has formed a descending channel formation.
~~ It has taken the strong support as resistance & bounce back in downward direction.
~~ Hence, it will be bearish from here.
Click image for original size
BTC/USD Technical Analysis
~~ BTCUSD pair has been in the bullish movement.
~~ Now, it was consolidating @ 10894 after breaking the symmetrical triangle pattern.
~~ Hence, we are expecting that it will be rebound to the upward movement further in the near term.
~~ BTCUSD pair has been in the bullish movement.
~~ Now, it was consolidating @ 10894 after breaking the symmetrical triangle pattern.
~~ Hence, we are expecting that it will be rebound to the upward movement further in the near term.
Click image for original size

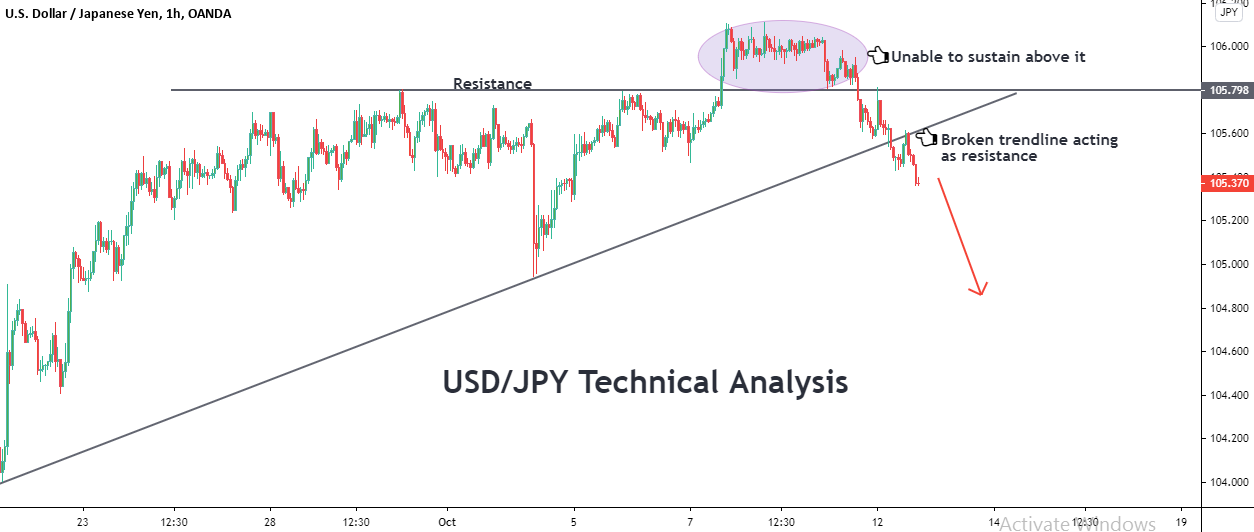
USD/JPY Technical Analysis
~~The counter broke the resistance of 105.8 but was unable to sustain above it.
~~ It has then encountered a strong sell-off and has broken a bullish trendline.
~~ Hence, we expect the pair to be bearish in the near-term.
~~The counter broke the resistance of 105.8 but was unable to sustain above it.
~~ It has then encountered a strong sell-off and has broken a bullish trendline.
~~ Hence, we expect the pair to be bearish in the near-term.
Click image for original size
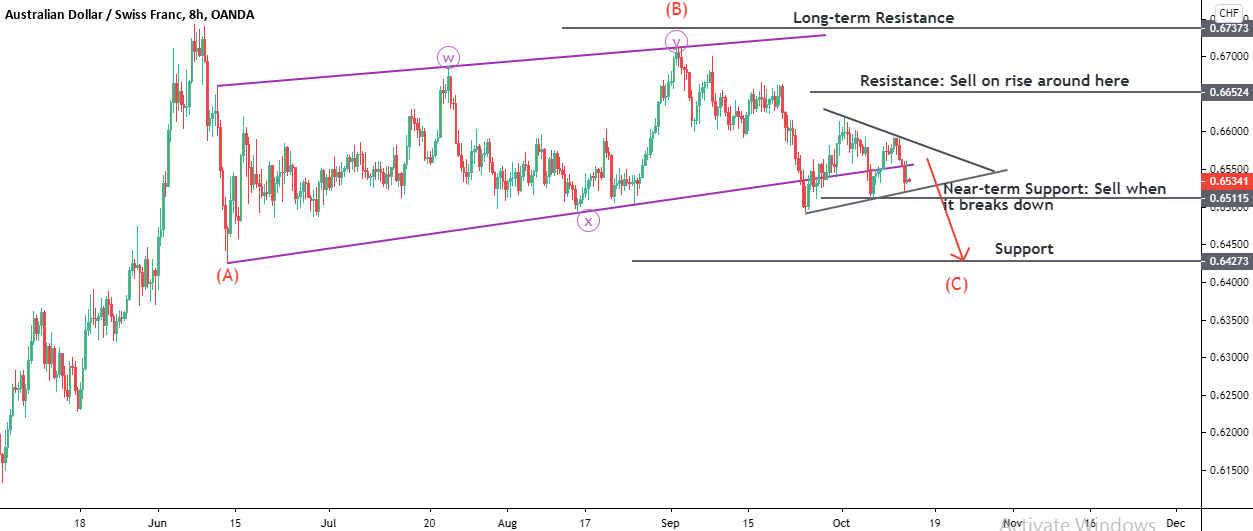
AUD/CHF Wave Analysis
~~ As we suggested earlier, the counter is currently in an ABC and has moved down significantly.
~~ Now, it is forming a triangle in the short-term charts.
~~ We advise our users to either sell at the resistance of 0.665 or when the price breaks down below 0.651.
~~ As we suggested earlier, the counter is currently in an ABC and has moved down significantly.
~~ Now, it is forming a triangle in the short-term charts.
~~ We advise our users to either sell at the resistance of 0.665 or when the price breaks down below 0.651.
Click image for original size
When it comes to long-term and short-term setups in forex trading, each has its own strategy and approach depending on your goals and risk tolerance. Understanding the differences and how to execute these setups effectively can make a significant difference in your trading success. Traders offer some insightful perspectives that might help you choose the right approach for your trading style.
Emini Day Trading /
Daily Notes /
Forecast /
Economic Events /
Search /
Terms and Conditions /
Disclaimer /
Books /
Online Books /
Site Map /
Contact /
Privacy Policy /
Links /
About /
Day Trading Forum /
Investment Calculators /
Pivot Point Calculator /
Market Profile Generator /
Fibonacci Calculator /
Mailing List /
Advertise Here /
Articles /
Financial Terms /
Brokers /
Software /
Holidays /
Stock Split Calendar /
Mortgage Calculator /
Donate
Copyright © 2004-2023, MyPivots. All rights reserved.
Copyright © 2004-2023, MyPivots. All rights reserved.