ES Monday 10-17-11
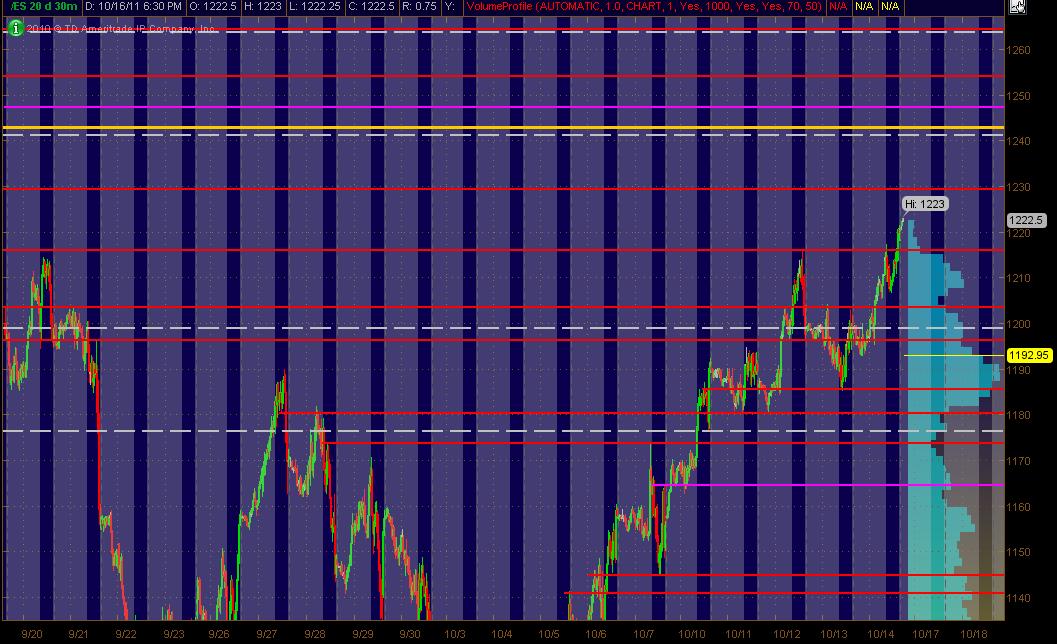
Here's what I've got in the way of a MAP for the ES coming into Monday's trading and the week. The Red Lines are potential significant PASR levels with any Magenta Lines as "semi" significant levels. White Dashed Lines are Wkly Pivots as per mypivots site. The Yellow line above the current market is a significant Fib Cluster fwiw.
The right vertical lighter Blue reflects 20 days of All Trading Hours Volume Profile. The Grayed out background is the non-RTH price activity. Hope this his helpful for some ... especially when incorporated with shorter term Volume Profile of the past 1 to several days ... looking at bell curves and more importantly, the High Volume Areas ... and the Low Volume Areas.
The right vertical lighter Blue reflects 20 days of All Trading Hours Volume Profile. The Grayed out background is the non-RTH price activity. Hope this his helpful for some ... especially when incorporated with shorter term Volume Profile of the past 1 to several days ... looking at bell curves and more importantly, the High Volume Areas ... and the Low Volume Areas.
Click image for original size
VIX at resistance
92.to 94. from thursday taking a shot
tick i think is not tell me much
yes richard...hard for me to post and trade...look here for the exact spots of interest....lorns charts and my comments below them
http://www.mypivots.com/board/topic/7009/1/es-friday-10-14-2011
http://www.mypivots.com/board/topic/7009/1/es-friday-10-14-2011
VIX at resistance now
yes see that thank you instant replay
different day but same story
Originally posted by BruceM
yes richard...hard for me to post and trade...look here for the exact spots of interest....lorns charts and my comments below them
http://www.mypivots.com/board/topic/7009/1/es-friday-10-14-2011
it really cool that when we come back down or go up you can go to that day on the forum and look back a see what was going on that day
Emini Day Trading /
Daily Notes /
Forecast /
Economic Events /
Search /
Terms and Conditions /
Disclaimer /
Books /
Online Books /
Site Map /
Contact /
Privacy Policy /
Links /
About /
Day Trading Forum /
Investment Calculators /
Pivot Point Calculator /
Market Profile Generator /
Fibonacci Calculator /
Mailing List /
Advertise Here /
Articles /
Financial Terms /
Brokers /
Software /
Holidays /
Stock Split Calendar /
Mortgage Calculator /
Donate
Copyright © 2004-2023, MyPivots. All rights reserved.
Copyright © 2004-2023, MyPivots. All rights reserved.