ES Monday 10-17-11
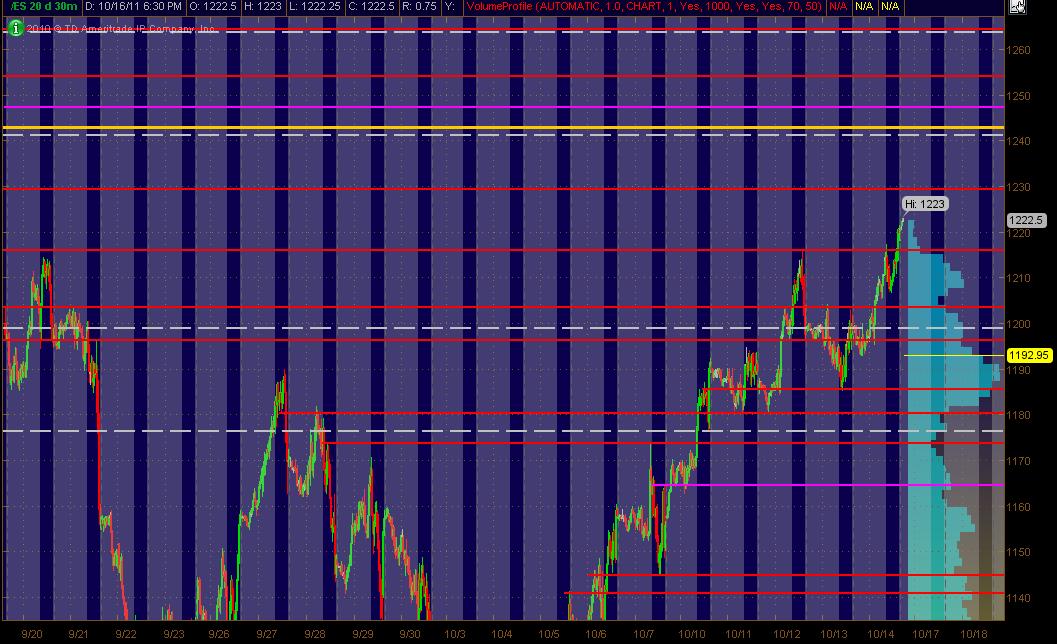
Here's what I've got in the way of a MAP for the ES coming into Monday's trading and the week. The Red Lines are potential significant PASR levels with any Magenta Lines as "semi" significant levels. White Dashed Lines are Wkly Pivots as per mypivots site. The Yellow line above the current market is a significant Fib Cluster fwiw.
The right vertical lighter Blue reflects 20 days of All Trading Hours Volume Profile. The Grayed out background is the non-RTH price activity. Hope this his helpful for some ... especially when incorporated with shorter term Volume Profile of the past 1 to several days ... looking at bell curves and more importantly, the High Volume Areas ... and the Low Volume Areas.
The right vertical lighter Blue reflects 20 days of All Trading Hours Volume Profile. The Grayed out background is the non-RTH price activity. Hope this his helpful for some ... especially when incorporated with shorter term Volume Profile of the past 1 to several days ... looking at bell curves and more importantly, the High Volume Areas ... and the Low Volume Areas.
Click image for original size
trading as if a magnet is attatched to 05.50....
and , hopefully, for "no follow through" to the downside
runners will try for 08.50 and 1210...gonna take a small miracle to hold this
INDU now above 11,500 support
thaanks lisa have good day boys and girls have flu or just bug
and thank you Lorn for giving us that one...!!!!
Bruce, are you in a long trade? or short?
LONG all the way...why would I be short when I have a hour breakdown into a key zone of 04 - 05 ...and we had an air pocket when I initiated...?
Originally posted by Lisa P
Bruce, are you in a long trade? or short?
lightening at 06.75...holding two...tricky to get upper targets when those targets sit inside all that volume from friday that can become resistance...
Lisa...i am not getting the point across if u needed to ask that......
Lisa...i am not getting the point across if u needed to ask that......
volume poc is trying to shift down to 1206.25 which in theory is bad for bulls as it is lower than Fridays.....but shift hasn't happened yet
it really cool that when we come back down or go up you can go to that day on the forum and look back a see what was going on that day
Emini Day Trading /
Daily Notes /
Forecast /
Economic Events /
Search /
Terms and Conditions /
Disclaimer /
Books /
Online Books /
Site Map /
Contact /
Privacy Policy /
Links /
About /
Day Trading Forum /
Investment Calculators /
Pivot Point Calculator /
Market Profile Generator /
Fibonacci Calculator /
Mailing List /
Advertise Here /
Articles /
Financial Terms /
Brokers /
Software /
Holidays /
Stock Split Calendar /
Mortgage Calculator /
Donate
Copyright © 2004-2023, MyPivots. All rights reserved.
Copyright © 2004-2023, MyPivots. All rights reserved.