Single Prints Forward Test - June 2005
The rules will change this month so I will be outlining the new rules here.
General changes so far:
Starting capital of $10,000 instead of $20,000.
Trade 2 contracts per trade instead of 4.
General changes so far:
Starting capital of $10,000 instead of $20,000.
Trade 2 contracts per trade instead of 4.
- The single print must be less than a month old to be used.
- The single print must be a confirmed single print.
- The entry price is one tick inside the single print and an entry will only be recorded if the price touches the single.
- A stop of one handle will be used.
- 2 contracts will be traded.
- First target is 2 points.
- Second target is 6 points.
- Commissions will be $5 per contract.
- Stop will be moved to break even after first target has been reached.
- Stop will not be trailed after moved to break even.
- No re-entries if stopped out but re-entries always taken if both contracts are taken off profitably and re-entry is then only allowed on that day. (This is logical because single tick will not be there on subsequent days.)
- All single trades will be taken irrespective of other news items or announcements that are being made at that point.
- If multiple singles created in same day or time period then all of them will be traded using the same stops and targets and rules.
- No overnight carry. Any open contracts/strategies are closed out at 16:10 EST. The first trade price on or after 16:10:00 will be used as the closing price.
- Positions that are triggered before 16:00:00 will be opened but not on or after 16:00:00 EST.
- Positions will be opened on or after 09:30:00 EST. If we open in a single trade we will assume an entry price of the first price traded on or after 09:30:00
1 June 2005: Update
1 long trade off 620.0 which was stopped out at a 1 point loss for cash loss of $210.
Spreadsheet updated - click here.
(This is the same spreadsheet as the May 2005 test but with extra sheets in it so you can compare the 2 strategies side by side.)
Monthly cumulative loss at this point is $210
1 long trade off 620.0 which was stopped out at a 1 point loss for cash loss of $210.
Spreadsheet updated - click here.
(This is the same spreadsheet as the May 2005 test but with extra sheets in it so you can compare the 2 strategies side by side.)
2 June 2005: Update
No trades today.
No trades today.
3 June 2005: Update
No trades today.
New single created in H bracket at 623.4
No trades today.
New single created in H bracket at 623.4
6 June 2005: Update
Short at 623.3 with stop at 624.3
Trade closed at first price traded at or after 16:10:00 according to our rules above for a 2 tick profit. Here is a chart of the trade:
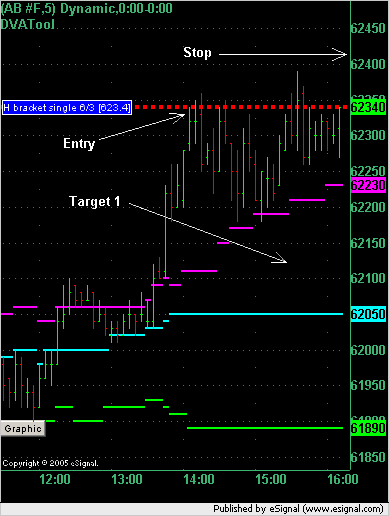
The DVATool that you see loaded on that chart now performs 3 major tasks to assist the Market Profile trader:
1. It draws in the Value Area High and Low and the Point of Control from yesterday (VAH, VAL, POC) (disabled on that image above)
2. It draws in the same developing lines for the current day. Those are the pink, cyan and lime lines you see on the chart.
3. It manages Single Print lines to assist you in points of entry and exit. The red line in the image is a filled single print.
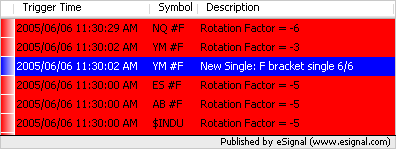
The DVATool also pops up alerts when a single is formed, such as this single formed in the YM today:
And when a single is filled such as this ER2 single filled today:
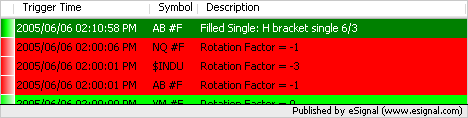
DVATool watches multiple markets for you and alerts you when a Single Print has been formed or filled.
Short at 623.3 with stop at 624.3
Trade closed at first price traded at or after 16:10:00 according to our rules above for a 2 tick profit. Here is a chart of the trade:
The DVATool that you see loaded on that chart now performs 3 major tasks to assist the Market Profile trader:
1. It draws in the Value Area High and Low and the Point of Control from yesterday (VAH, VAL, POC) (disabled on that image above)
2. It draws in the same developing lines for the current day. Those are the pink, cyan and lime lines you see on the chart.
3. It manages Single Print lines to assist you in points of entry and exit. The red line in the image is a filled single print.
The DVATool also pops up alerts when a single is formed, such as this single formed in the YM today:
And when a single is filled such as this ER2 single filled today:
DVATool watches multiple markets for you and alerts you when a Single Print has been formed or filled.
Guy, did you reverse when the singles were created at 621.9 intraday?They did not fill in by more than 7 ticks.
Fives
Fives
Fives: There weren't any singles created at 621.9 today. That was an error in the eSignal MP chart. If you go back to the beginning of the day you would have seen that there was a D print at 621.9 as well as an L print later in the day so there were double TPOs at 621.9 and therefore no singles. (Go back and look at the high on a bar chart during the D bracket. eSignal MP chart is missing a D print at 621.9)
The DVATool picked this up and so if you were trading off it (which I was) then you would not have seen singles there like you did on the Market Profile chart.
Ironically the chart with the error (eSignal's MP chart) produced a more profitable day today if you had reversed where it showed a single. Such is life.
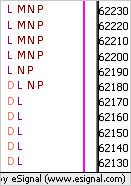
I didn't have time to do this yesterday but I can now show you a snippet of the MP charts.
The prices around the questionable 621.9 price according to the DVATool are:
[622.30] LMNP [DVAH]
[622.20] LMNP
[622.10] LMNP
[622.00] LMNP
[621.90] DLNP
[621.80] DLNP
[621.70] DL
[621.60] DL
[621.50] DL
[621.40] DL
And here is the chart that was produced by eSignal showing the missing D print at 621.9 which caused a single to show during trading.
If you look back at a bar chart over the first bracket of the day you will see that the high was 621.9 and so the eSignal MP chart should have shown a D print at that price.
The prices around the questionable 621.9 price according to the DVATool are:
[622.30] LMNP [DVAH]
[622.20] LMNP
[622.10] LMNP
[622.00] LMNP
[621.90] DLNP
[621.80] DLNP
[621.70] DL
[621.60] DL
[621.50] DL
[621.40] DL
And here is the chart that was produced by eSignal showing the missing D print at 621.9 which caused a single to show during trading.
Click image for original size
If you look back at a bar chart over the first bracket of the day you will see that the high was 621.9 and so the eSignal MP chart should have shown a D print at that price.
6 June 2005: Update (continued)
1 short trade at 623.3 which made a 2 tick profit of $40 ($30 net).
Spreadsheet updated - click here.
Monthly cumulative loss at this point is $180
1 short trade at 623.3 which made a 2 tick profit of $40 ($30 net).
Spreadsheet updated - click here.
Yes Fives, I've currently got a limit order waiting down there to go long (time now 12:02 EST). Here is a snippet of the MP chart at 12:02 EST:
[630.40] EFGHI [DPOC]
[630.30] EFGH
[630.20] EFGH
[630.10] EFGH
[630.00] EFGH
[629.90] EFGH
[629.80] EFGH
[629.70] EFGH
[629.60] EGH
[629.50] EGH
[629.40] EG
[629.30] E
[629.20] E
[629.10] E
[629.00] E
[628.90] DE
[628.80] DE [DVAL]
[628.70] DE
[628.60] DE
[628.50] DE
[628.40] D
At the time of writing this the DVAL was just 2 ticks below the single so forming a cluster which strengthens the idea of a long on this single.
Buzz: Just looking at the single trade yesterday and notice that if the single print is created on the same day that it's triggered then there is no VA to compare the opening price against. You will notice that I put N/A in that column in the spreadsheet that I updated today for yesterday's single print trade in the ER2.
Emini Day Trading /
Daily Notes /
Forecast /
Economic Events /
Search /
Terms and Conditions /
Disclaimer /
Books /
Online Books /
Site Map /
Contact /
Privacy Policy /
Links /
About /
Day Trading Forum /
Investment Calculators /
Pivot Point Calculator /
Market Profile Generator /
Fibonacci Calculator /
Mailing List /
Advertise Here /
Articles /
Financial Terms /
Brokers /
Software /
Holidays /
Stock Split Calendar /
Mortgage Calculator /
Donate
Copyright © 2004-2023, MyPivots. All rights reserved.
Copyright © 2004-2023, MyPivots. All rights reserved.