ES 12-05-08
GOOD MORNING ALL! Well as you know im not a big fan of longer term forecasts, but i keep getting asked so much that thats why i posted some views the other day on the globex thread and the trading strategies forum. I bring it up not to receive plaudits but because im trying to 'teach' you that the techniques i have shown you here(price proj. and cycles) work on any time frame and in any market for that matter! I have always made good money from the markets but my dream has always been to create an 'army' of traders as skilled (or better!) as i am to level the playing field at this giant casino we call the financial markets. When i made the case for a top in the market tue-wed with 872.50-877 being the prime resistance area im sure most were skeptical, and heck, coming off of the most oversold market in history thats understandable.
- Page(s):
- 1
- 2
- 3
- 4
- 5
- 6
- 7
- 8
- 9
- 10
- 11
- 12
- 13
- 14
- 15
- 16
- 17
- 18
- 19
- 20
- 21
- 22
- 23
- 24
- 25
- 26
- 27
- 28
- 29
- 30
- 31
- 32
- 33
- 34
- 35
- 36
- 37
- 38
- 39
- 40
- 41
- 42
AND YOU WITH ME VO!,,C YA..PALMER YOU STLL OWE ME A BEER SOMEDAY...LOL
Can't wait. My wife thinks I'm crazy. Up in my office until the wee hrs. going over Kools writings and charts.
Everyone, enjoy the weekend, and thanks for making this fun!
Hi all, new in here. Can anyone tell me why I can't see the pics in here? I use to see chart when you guys past it in here but now I see nothing. Anyone any clue?
Click image for original size
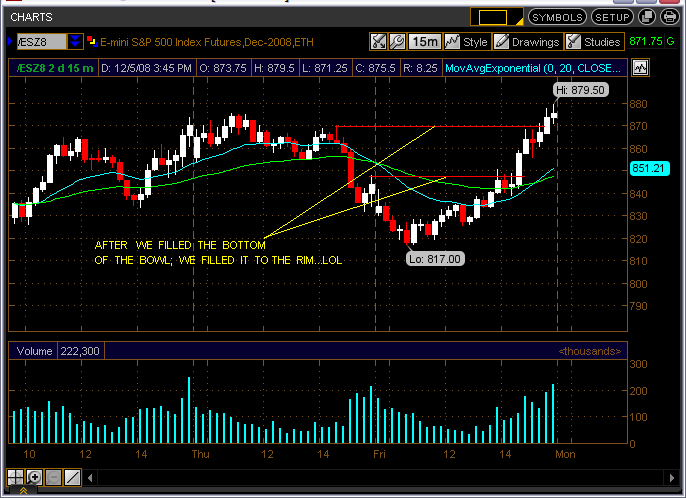
We traded inside an unfilled 15min RTH falling gap
@ 894.50 / 870.75 from 11/28--12/1
870.75 is also the high for 12/1...FWIW

I'm trying to get my mind around the accuracy of kool's cycles especially so considering the 1000 V chart is not a fixed time scale.
I wonder if these volume (and tick) charts have the potential of being even more accurate than a fixed time chart, say a 5 minute chart for example. With a volume based chart you are able to go inside a single bar on the fixed time frame chart. I call it "time splicing" the fixed time bar. So for example, on a fast volume chart you often have a series of bars formed within what is represented by a traditional 1 minute or 5 minute bar chart. This opens the potential to accurately nail a kool cycle turning point to within seconds...
I wonder if these volume (and tick) charts have the potential of being even more accurate than a fixed time chart, say a 5 minute chart for example. With a volume based chart you are able to go inside a single bar on the fixed time frame chart. I call it "time splicing" the fixed time bar. So for example, on a fast volume chart you often have a series of bars formed within what is represented by a traditional 1 minute or 5 minute bar chart. This opens the potential to accurately nail a kool cycle turning point to within seconds...
quote:
Originally posted by euro_mark
Hi all, new in here. Can anyone tell me why I can't see the pics in here? I use to see chart when you guys past it in here but now I see nothing. Anyone any clue?
I think you have to be logged into your account before viewing the thread containing the chart.
COULD BE FRIEND, NEEDS FURTHER INVESTIGATION! Im convinced that if i had enough time to spare, theoretically one could 'map' the next hours or even next days action just from my cycles! The fact that thecycles seem to hold true even on a non-fixed time chart is facinating to me!(and unexpected!) I have however used my price proj. and cycle techniques in the past just for fun to accurately predict wierd things like gdp, unemployment etc so maybe its not so surprising after all.
Welcome to the forum UKtradergirl
These dynamic charts (volume and tick charts) take a little getting used to at first. VO uses a 610 tick chart which matches my volume chart fairly closely.
These dynamic charts (volume and tick charts) take a little getting used to at first. VO uses a 610 tick chart which matches my volume chart fairly closely.
Emini Day Trading /
Daily Notes /
Forecast /
Economic Events /
Search /
Terms and Conditions /
Disclaimer /
Books /
Online Books /
Site Map /
Contact /
Privacy Policy /
Links /
About /
Day Trading Forum /
Investment Calculators /
Pivot Point Calculator /
Market Profile Generator /
Fibonacci Calculator /
Mailing List /
Advertise Here /
Articles /
Financial Terms /
Brokers /
Software /
Holidays /
Stock Split Calendar /
Mortgage Calculator /
Donate
Copyright © 2004-2023, MyPivots. All rights reserved.
Copyright © 2004-2023, MyPivots. All rights reserved.