CHARTS 12-31-08

Click image for original size
Click image for original size
nope, VO JUST ME , A BEER , AND A FUNNY HAT!
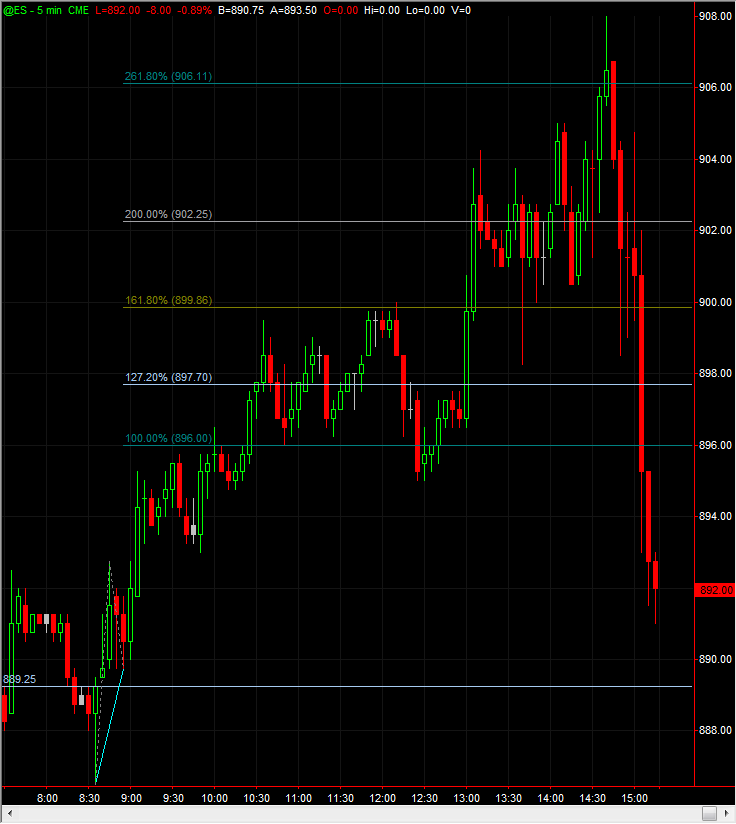
HERES HOW I ANALYISE TRADE SET UPS!.....

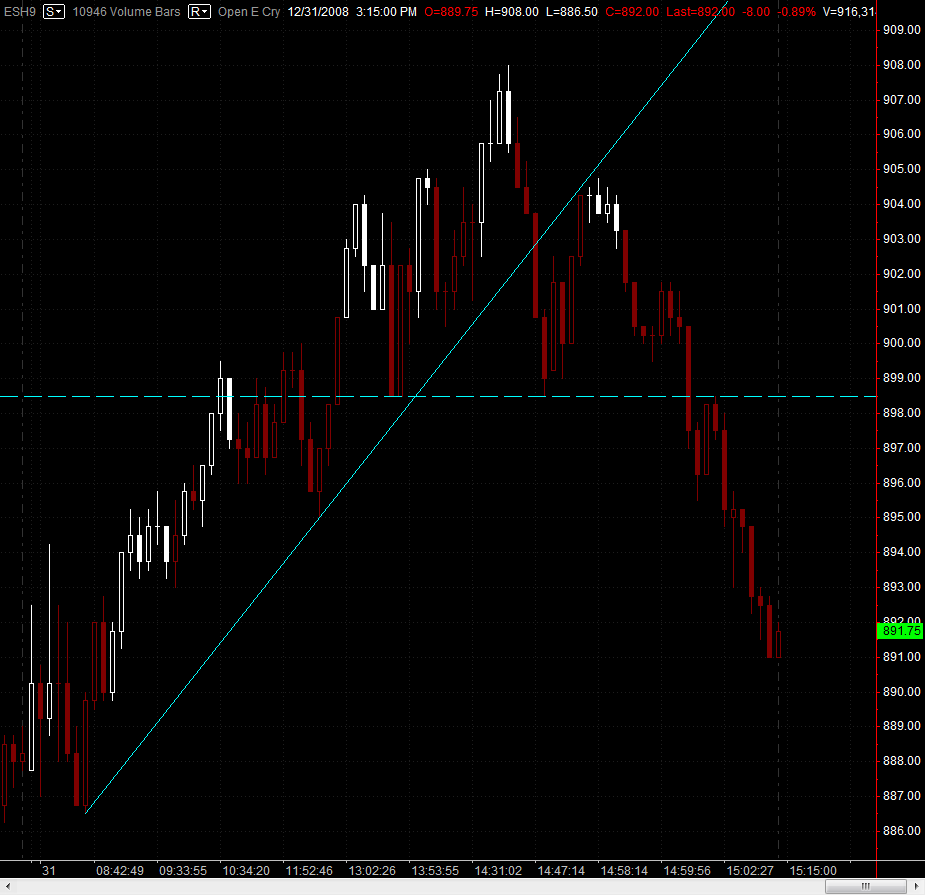
SO in a nutshell ... if not so late id sell 904.00,probably exiting at the first 'stall ' around 899.75- 900, then later buy around 902.50 or lower around 4:15-16 for a long scalp, exiting early at 895 area
Click image for original size
Click image for original size
Click image for original size
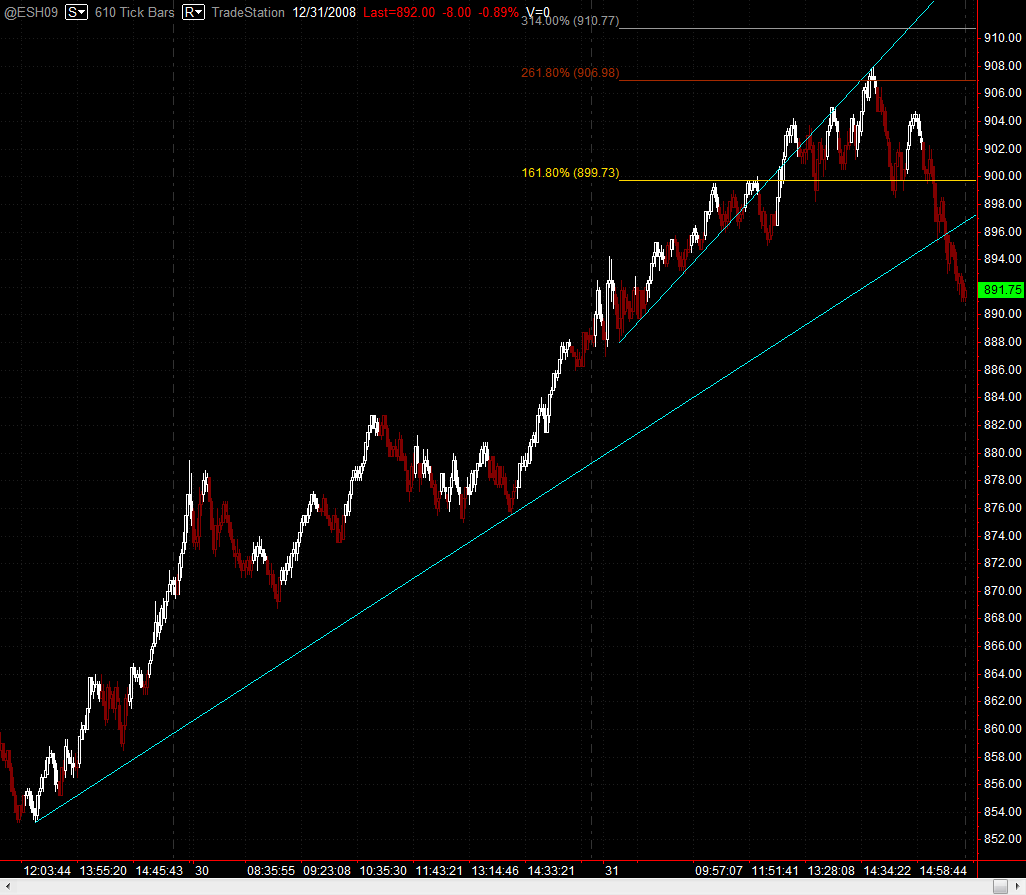
Thanks both of you, VO what time frame & bar count is your zigzag on? It's hard to test a new tool with the slow low vol days. I posted a 3 min set to 5 bars, I am also watching a 610T & a 1 minuite Thnx
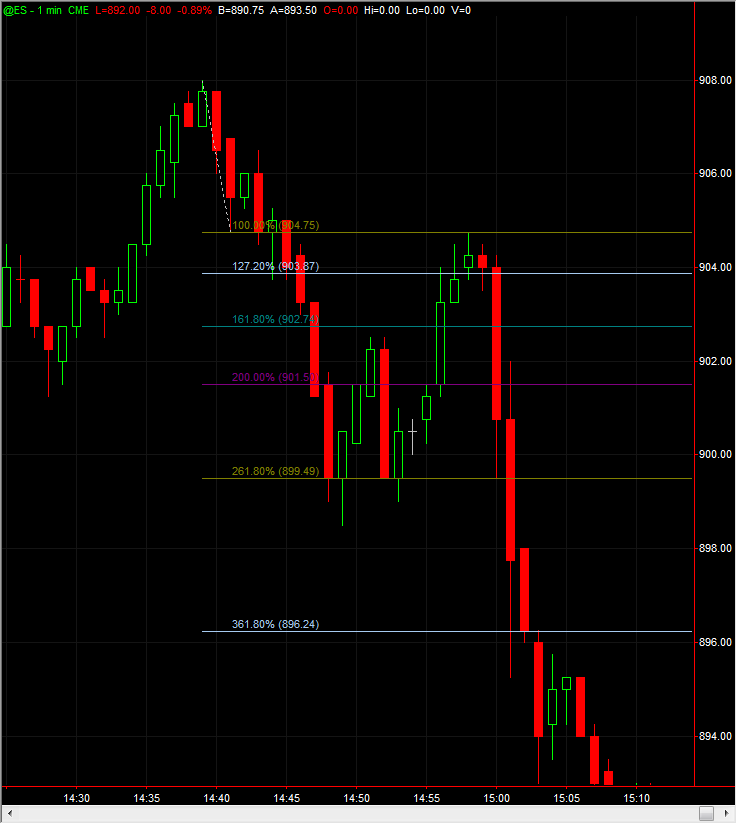
quote:your exactly correct, sir! i think i showed that on another chart. my intention here was to show the possibility of a potential bounce at the 891 level before we get there! The initial thrust always gives the valid projection, but remember my theory that every bar potentially has its own story to tell.
Originally posted by einstein
Happy New Year Kool and the gang! Kool,still a little confused on why you are using the high of 904.75 and low of 899.50. It seems to me that the down thrust initiates at the high of the up candle (15:40) at 908 and continues down for 2 more bars until u get a signif retrace at the 15:55 candle ie the low of the second big red candle at 898.50. This would give a projection down to 883.5 at the 1.618% level. If I am way off please correct me. Just trying to be more precise and accurate on these price projections. Thanks as always. E.
Emini Day Trading /
Daily Notes /
Forecast /
Economic Events /
Search /
Terms and Conditions /
Disclaimer /
Books /
Online Books /
Site Map /
Contact /
Privacy Policy /
Links /
About /
Day Trading Forum /
Investment Calculators /
Pivot Point Calculator /
Market Profile Generator /
Fibonacci Calculator /
Mailing List /
Advertise Here /
Articles /
Financial Terms /
Brokers /
Software /
Holidays /
Stock Split Calendar /
Mortgage Calculator /
Donate
Copyright © 2004-2023, MyPivots. All rights reserved.
Copyright © 2004-2023, MyPivots. All rights reserved.