5/5 Midday Trading?
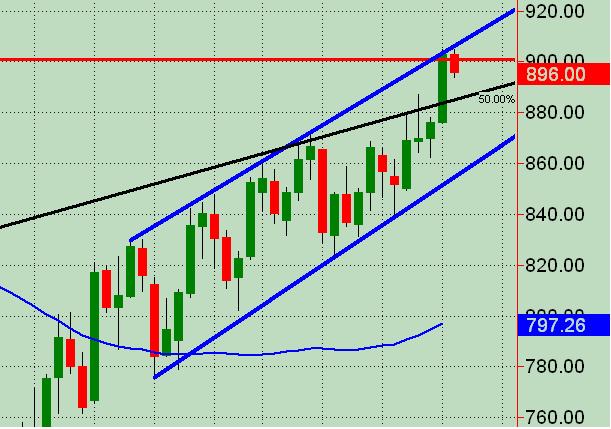
Snore! After an NR/4 (NR/7) the mkt broke out yday and gave us a WR day up to the top end of what I have as an upper trendline across the past few weeks on the daily. Currently we have an ES range of 11 points ... which is narrower than the Friday NR. Are odds pointing to an increase in today's range by the close ... in other words, a semi-decent break of the session's current high or low??? Have posted an ES daily chart with a channel in blue. Shorted the NQ a little bit ago ... decided to scratch for a few ticks. Anyone seeing anything of significance as of yet?
Click image for original size
Hey SPQR, are you still looking to short 905.25 if it gets there (even during overnight session), or does that RSI buy nix it? it seems there may be at least a reaction off of that price ... lemme know.
I'm gonna watch price action during the evening and will be watching that area ... the messy double bottom today along with the fact that we closed near the high and no rtc of WR up bar ... plus NR forever day has me conflicted about going short even up against the upper trendline on my daily chart.
I'd like to take a position but won't because of my "confliction affliction." What say you at this point about shorting 905.25?
I factored from 89 three complete waves plus 36.618 to 89 squared puts a fourth wave to correct the entire movement atleast 50% at 05.25. They slammed 04.75. They rocked even harder 05.
That's two waves a tick apart; and really the second was from a failed first. They're moving up strong to put in a third, but I'm expecting it to stop dead, at 05.25.
2 point hard stop, just in case.
That's two waves a tick apart; and really the second was from a failed first. They're moving up strong to put in a third, but I'm expecting it to stop dead, at 05.25.
2 point hard stop, just in case.
I'll be looking to buy heavy any price's above mon-tues range, and holding till Friday afternoon. With a NR7 I am looking for another nice trend day again.
My point: They're selling into the night, and if they're selling as hard as think they will off a fourth wave, then they'll be no where near the high, which nullifies the NR7 for a buy. We'll then be dealing with a full-on bear hook, and the direction of the movement at open will determine trend direction by fading it.
That's Crabel.
That's Crabel.
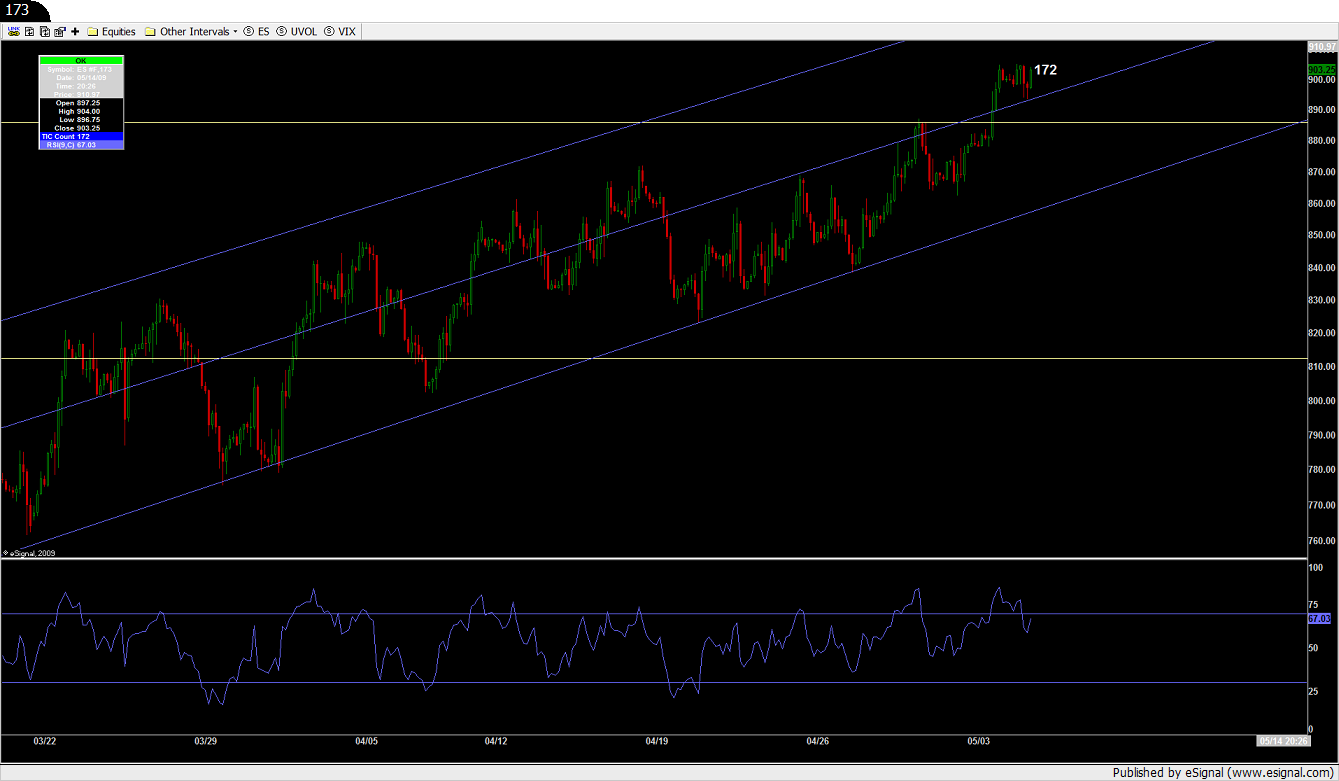
Here's my 173 minute Gann 30 degree cycle and Elliot chart. Look how hard they sold the 30 degree. We spent two weeks trying to make support out of it.
Sellers sold the 60 but didn't correct on headfakes holding near every corner on the way up. Buyers blew through the 60 but stalled low huns double and triple topping everything, but buyers came back strong off the bounce of the mid-line channel.
They're going to test the bounce and they're then testing the 60 degree where it's up in the air at that point if this is the top or they'll buy a pullback.
Longer term: they never made support out of the 30. A legitimate bull out of this short-covering bounce and pikers running it up high off of emotions has to hold the 30.
I'll be short here shortly position holding aiming for the low 8 huns.
I factored 807 a couple weeks ago. Nothing's changed.
Click image for original size
No bias right now. But if waterboarded would say long ... even though this chart of a Measured Move is something that I was watching. Lots of other factors at work here. Don't know if there are any fib projections/extensions etc. here or not. Haven't looked at that yet.
Just another piece of an always elusive puzzle.
Just another piece of an always elusive puzzle.
Click image for original size
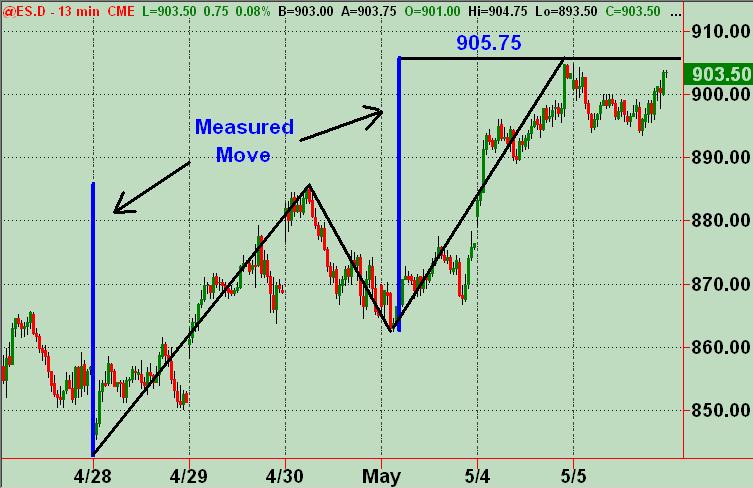
And just saw your chart SPQR ... with that channel and just the price action ... up and consolidating above the midline with a test of it (along with what else I'm seeing, some of which I've posted about Crabel related stuff)... leaves me still biased long regardless of my above posted chart. Don't intend to get into analysis paralysis here. Only want to look at everything that's on the table. Then read the mkt as it unfolds. Helpful chart there though!
It may not mean anything to anyone other than me at this point, but I'm still looking at 8:31:09 PM tonite. The cycle began on that sell off the 60 and didn't correct. Any other time I'ld say long with the consolidation above the line they finally broke, but a) it's an irregular top b wave that was supposed to correct at least to 55 from 85ish being the fifth wave off a failed 2nd, and b) if that isn't a descending ending bear flag, I may as well hang it up.
Just posting what I'm seeing.
Just posting what I'm seeing.
Get a load of this:
My 29.530589 minute chart:
My 29.530589 minute chart:
Click image for original size
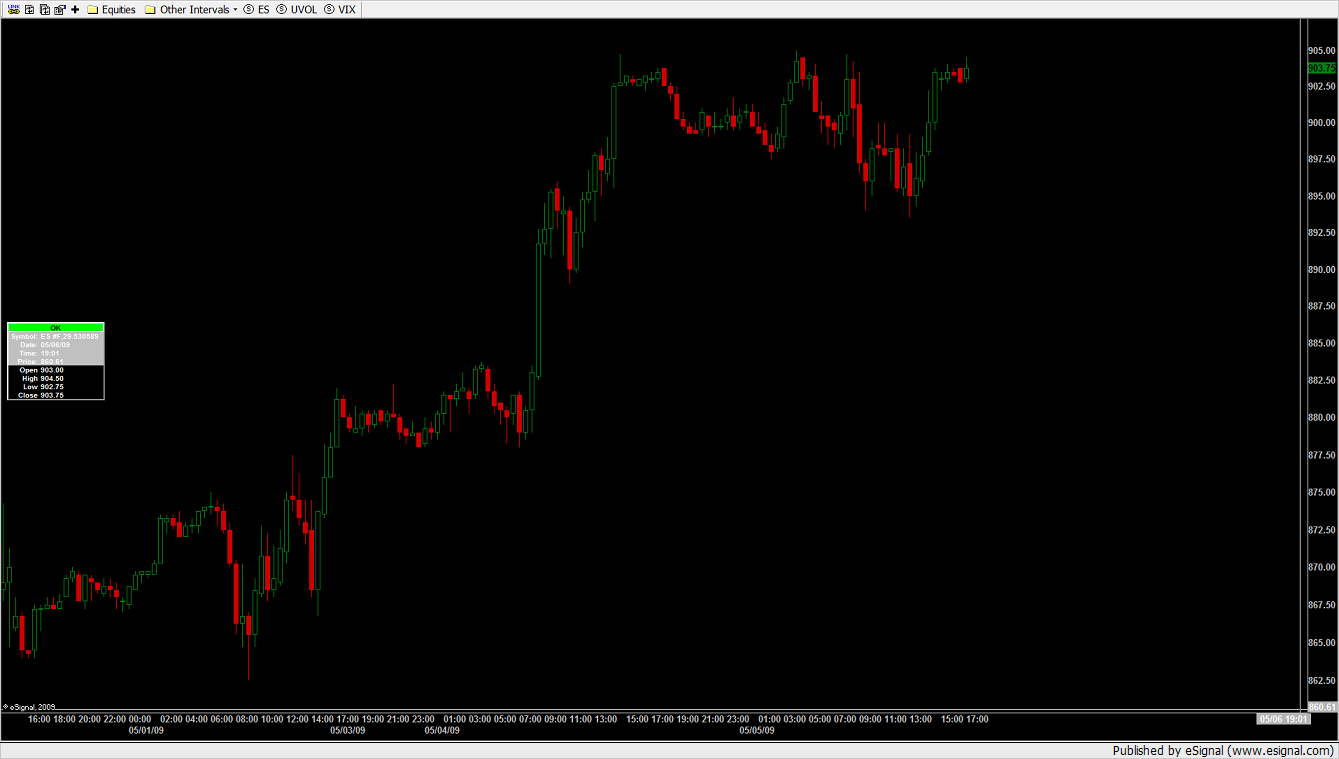
Another consideration is Friday's gap a point below the high of 76. What do they call that? An exhaustion gap?
Methinks.
I like many of you have a projection to this month's pivot at 911, and wouldn't that be ironic. But..
And Joe said we should be in the 70s today to buy this thing. Throwing everyone for a loop. Sure we're going up?
Methinks.
I like many of you have a projection to this month's pivot at 911, and wouldn't that be ironic. But..
And Joe said we should be in the 70s today to buy this thing. Throwing everyone for a loop. Sure we're going up?
Some good overnight trade entries, both short and long Joe !!
Emini Day Trading /
Daily Notes /
Forecast /
Economic Events /
Search /
Terms and Conditions /
Disclaimer /
Books /
Online Books /
Site Map /
Contact /
Privacy Policy /
Links /
About /
Day Trading Forum /
Investment Calculators /
Pivot Point Calculator /
Market Profile Generator /
Fibonacci Calculator /
Mailing List /
Advertise Here /
Articles /
Financial Terms /
Brokers /
Software /
Holidays /
Stock Split Calendar /
Mortgage Calculator /
Donate
Copyright © 2004-2023, MyPivots. All rights reserved.
Copyright © 2004-2023, MyPivots. All rights reserved.