2 to 1
Wanted to offer the following in the hope that others might review with a constructive eye and, perhaps, conduct additonal backtesting. My technical abilities are limited, so I backtest manually.
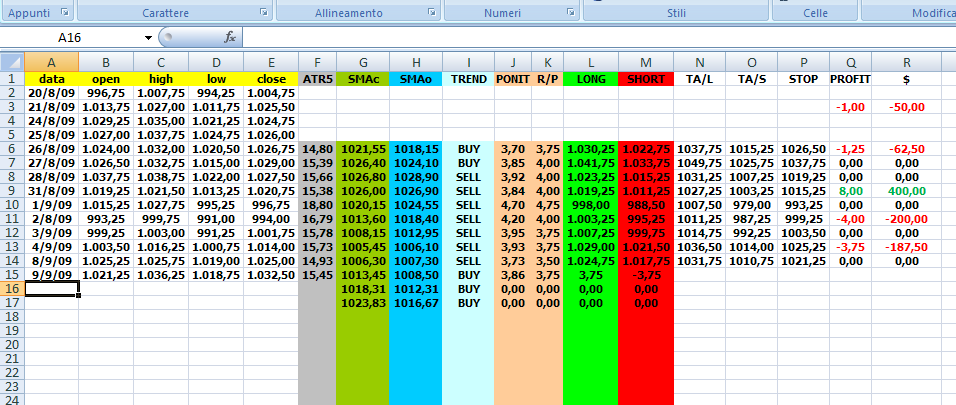
The results for the 28 trading days between Apr 2 - May 12 on NQ June show 19 trades. 13 W 164 points 5L 29.75 points 1 BE. Gross of 134.25 points - $2685 before commission
Methodology
Chart set up: On a day session chart plot the 5 period average true range. Also plot a 5 period simple moving average of both the close and the open. Longs are taken only when the 5 period SMA of the close is above the 5 period SMA of the open. Shorts only when below.
Entries and Exits: If taking longs, add 50% of yesterday's ATR to today's open. This is the entry. Exits are either - a stop order at today's open, limit order at 50% of yesterday's ATR added to today's open, or MOC. For shorts simply reverse.
Having a target that is twice the stop really helped when I manually tested this for the same period as above on the 10 yr note (ZN June). 18 trades were taken. 8 W 83.5 points 10 L 47.5 points Gross of 36.5 points - $1140.62 before commission.
Thanks in advance for your constructive ideas for improvement and any additional backtesting you might undertake.
edit - 25% atr changed to 50%
What time frame??
I just wanted to say thanks and this is a cool thing. I changed it a bit, I don't much like systems there are too many variables and I find myself not following them as I should which is a good thing, I think trading needs a human element. Although I do have systems like the mini I.B. but thats a timed system so I know when its going to generate a trade, I would have to go over the numbers and see the max draw down. But I have been playing with it tonight and am happy you posted this. I am looking at a 5min chart and a 1 min chart, and slowed it down to 10, I see as long as the market is moving well it keeps you on the right side for at least 90% of the move and has less noise than SAR's.
This goes well with my 30 min RSI. Would be cool if I could run these 2MA's on the RSI
This goes well with my 30 min RSI. Would be cool if I could run these 2MA's on the RSI
On the daily the buy line has been above the sell since 3/12 @ 708...not bad
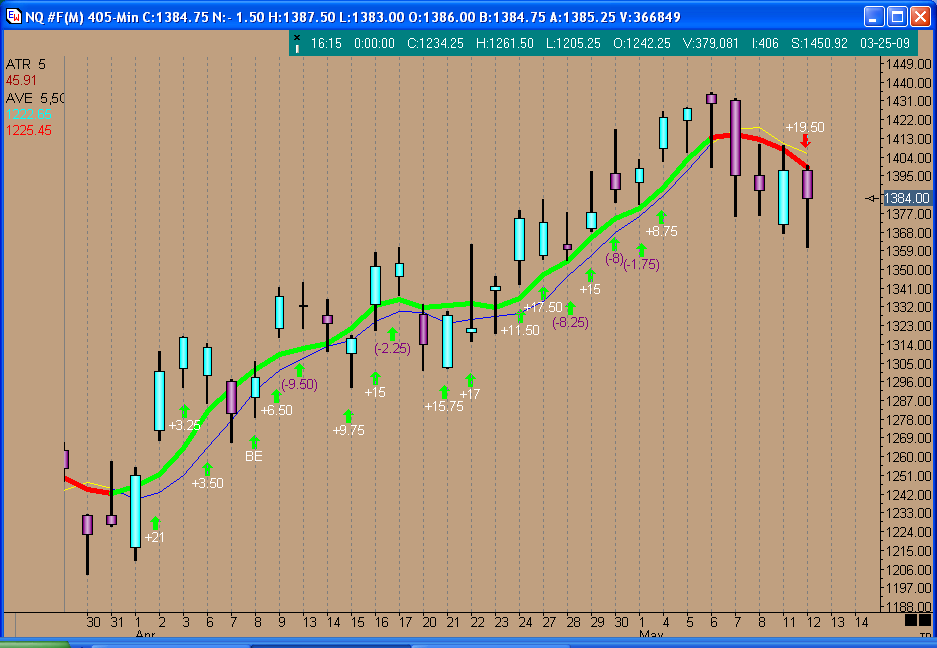
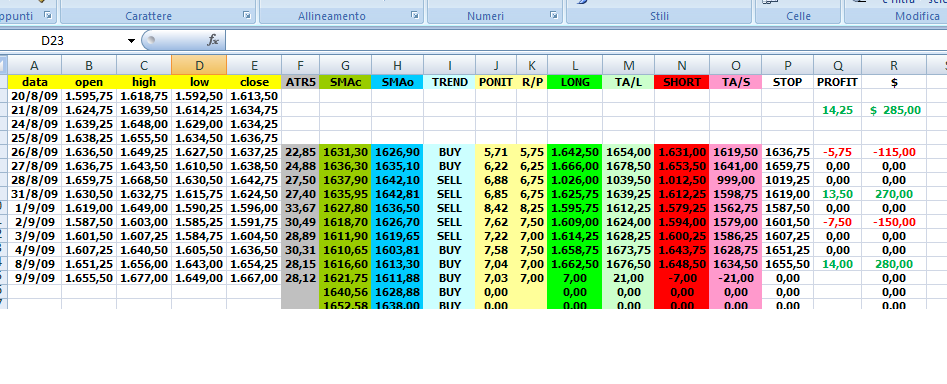
The ATR and SMA's are applied to daily (day session charts). Then 25% of yesterday's 5 period ATR is applied to today's open. Added for a long entry and subtracted for a short. Going long/short for the day is dependent upon whether the 5period Close SMA is above or below the 5 period Open SMA on the daily chart. Entries and exits are intraday and can be followed within any time frame you like...1m, 3m, ...10m etc.
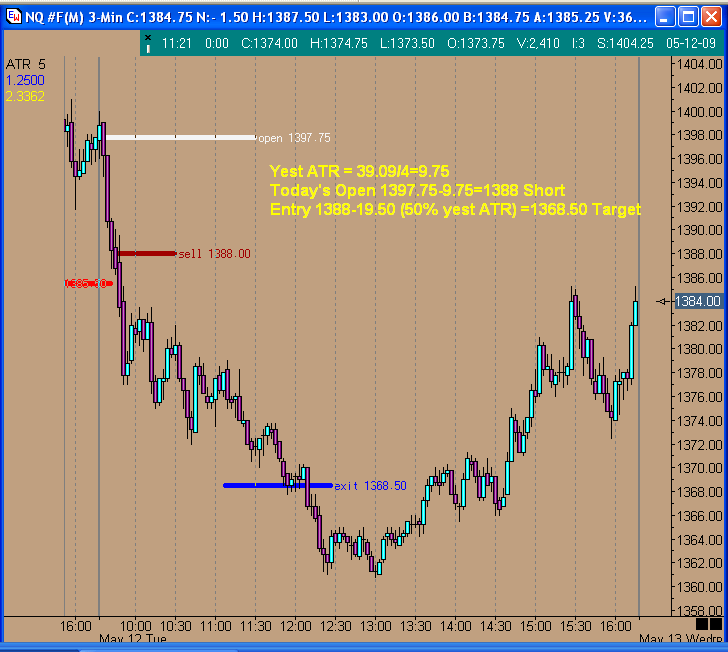
Here are the trades since April 2 on the Daily NQ chart. The second chart is how I followed along on today's trade on the NQ using a 3M chart.
Click image for original size
Click image for original size
PaulR:
I think I must be missing something. If you add 25% of yest ATR to open for long entry (lets say ATR was 20, so 5 + open), and target is 50% of yest ATR plus open ( 20 X .5 = 10), isnt the reward the difference (10 - 5) and risk to open is 5, so 1 to 1? My math is shaky at best though, lol.
Thanks
I think I must be missing something. If you add 25% of yest ATR to open for long entry (lets say ATR was 20, so 5 + open), and target is 50% of yest ATR plus open ( 20 X .5 = 10), isnt the reward the difference (10 - 5) and risk to open is 5, so 1 to 1? My math is shaky at best though, lol.
Thanks
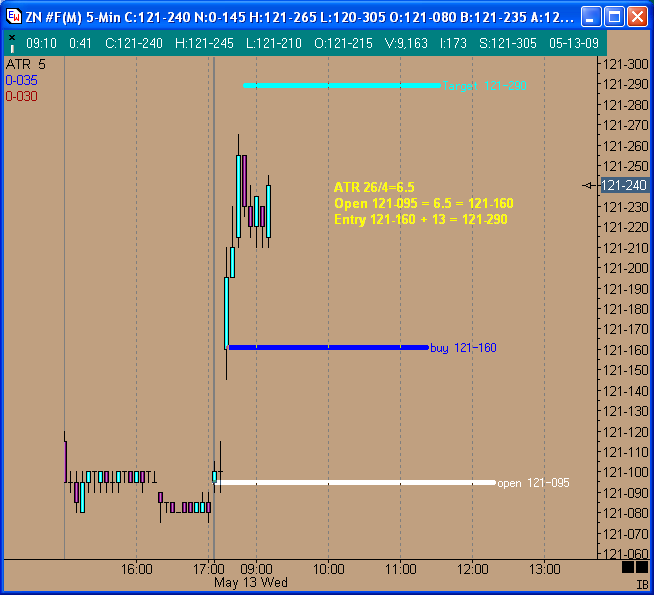
Ninja...yes its 50% of yesterday's ATR added to entry. Sorry for the lack of clarity in my explanation. That's the target. The stop is if price comes back to the open. If neither is hit you exit MOC. Any suggestions for improvement and/or independent backtesting on other instruments will be appreciated.
Here's the way things started out today on the 10 year note (ZN June). Long at 121-016 with a target of 121-290.
Click image for original size
Thanks for sharing this. Quite interesting!
quote:
Originally posted by PAUL9
that's OK daytrading, I just have to make a few more posts. But when I saw that RUSS had 9 I wondered, how many do you need?
hi,
you please check if my levels are correct?
Click image for original size
Click image for original size
Emini Day Trading /
Daily Notes /
Forecast /
Economic Events /
Search /
Terms and Conditions /
Disclaimer /
Books /
Online Books /
Site Map /
Contact /
Privacy Policy /
Links /
About /
Day Trading Forum /
Investment Calculators /
Pivot Point Calculator /
Market Profile Generator /
Fibonacci Calculator /
Mailing List /
Advertise Here /
Articles /
Financial Terms /
Brokers /
Software /
Holidays /
Stock Split Calendar /
Mortgage Calculator /
Donate
Copyright © 2004-2023, MyPivots. All rights reserved.
Copyright © 2004-2023, MyPivots. All rights reserved.