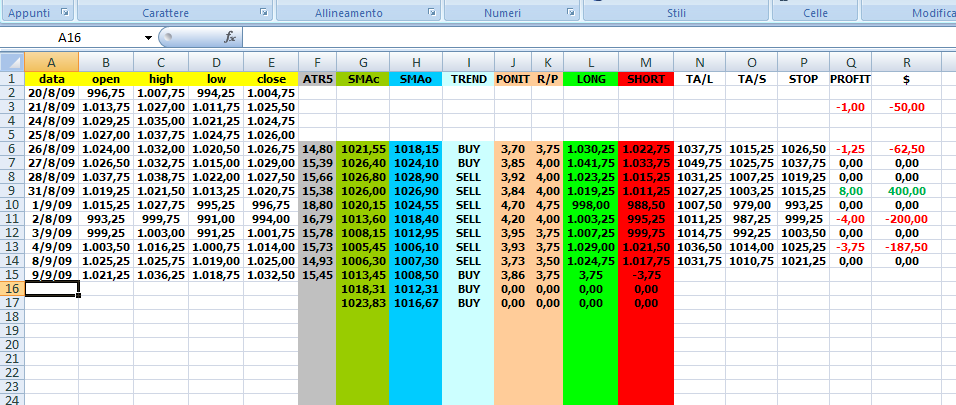
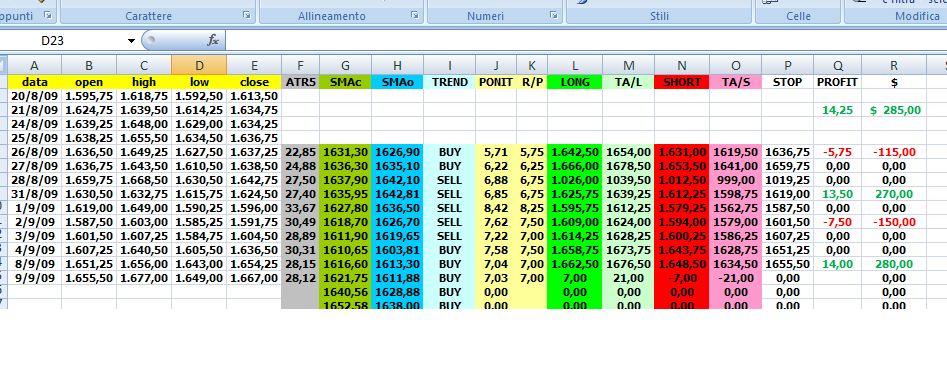
Wanted to offer the following in the hope that others might review with a constructive eye and, perhaps, conduct additonal backtesting. My technical abilities are limited, so I backtest manually.
The results for the 28 trading days between Apr 2 - May 12 on NQ June show 19 trades. 13 W 164 points 5L 29.75 points 1 BE. Gross of 134.25 points - $2685 before commission
Methodology
Chart set up: On a day session chart plot the 5 period average true range. Also plot a 5 period simple moving average of both the close and the open. Longs are taken only when the 5 period SMA of the close is above the 5 period SMA of the open. Shorts only when below.
Entries and Exits: If taking longs, add 50% of yesterday's ATR to today's open. This is the entry. Exits are either - a stop order at today's open, limit order at 50% of yesterday's ATR added to today's open, or MOC. For shorts simply reverse.
Having a target that is twice the stop really helped when I manually tested this for the same period as above on the 10 yr note (ZN June). 18 trades were taken. 8 W 83.5 points 10 L 47.5 points Gross of 36.5 points - $1140.62 before commission.
Thanks in advance for your constructive ideas for improvement and any additional backtesting you might undertake.
edit - 25% atr changed to 50%
JB
jbux
Rep: 0
Posts: 18
I think that by using "inside the bar backtesting" it catches the intraday action.
JB
JB
RU
Russ_OK
Rep: 0
Posts: 9
ibux,
I don't know how "inside the bar backtesting" works. It may be a good idea to look to see if in fact that is what it is doing before relying on the results.
Thanks for you efforts.
Russ
I don't know how "inside the bar backtesting" works. It may be a good idea to look to see if in fact that is what it is doing before relying on the results.
Thanks for you efforts.
Russ
PA
PaulR
Rep: 130
Posts: 119
John:
Ensign, my charting package calculates the 5 day ATR, which is what I currently use.
I noticed for ZN you are using a start time of 8:20...I use 9:30 with the same close you have of 17:00...5PM
Good work here. Thanks. Will look over ZN results.
Ensign, my charting package calculates the 5 day ATR, which is what I currently use.
I noticed for ZN you are using a start time of 8:20...I use 9:30 with the same close you have of 17:00...5PM
Good work here. Thanks. Will look over ZN results.
PA
PaulR
Rep: 130
Posts: 119
Today's numbers.
ES long @ Open + 3.25 target 6.50.
NQ Long @ Open + 6 target 12.
ZN Short @ Open - 7 target 14.
ES long @ Open + 3.25 target 6.50.
NQ Long @ Open + 6 target 12.
ZN Short @ Open - 7 target 14.
JB
jbux
Rep: 0
Posts: 18
Here is a calculator for different products. Excel File
(Inputs are in yellow boxes only)
JB
(Inputs are in yellow boxes only)
Click link to access uploaded file:
JB_ATR_Calculator.xls
JB_ATR_Calculator.xls
JB
PA
PaulR
Rep: 130
Posts: 119
Both ES & NQ hit their targets. Zn triggered just a little bit ago. Even if it loses we'll have a nicly green day. If it wins, we'll have a very nice day!
John that calculator is really convenient. Lots of good work there. Very much appreciated.
John that calculator is really convenient. Lots of good work there. Very much appreciated.
JB
jbux
Rep: 0
Posts: 18
My NQ and ES got Long but since my ATR's are much larger than yours
(NQ = 27.80 ES = 15.60 ) the profit targets (1634.6 + 995.45) have not been met. I can't figure out why our ATR's differ by so much.
I am using the Tradestation ATR (5 period).
My average ranges for today are also large ( NQ 27.4 ES 15.3)
John
(NQ = 27.80 ES = 15.60 ) the profit targets (1634.6 + 995.45) have not been met. I can't figure out why our ATR's differ by so much.
I am using the Tradestation ATR (5 period).
My average ranges for today are also large ( NQ 27.4 ES 15.3)
John
PA
PaulR
Rep: 130
Posts: 119
John:
We have different data feeds, so things may be different due to that, and just to confirm, I only look at RTH numbers trading from 9:30 to 4:15 on ES & NQ. Let's start by comparing the High's & Lows on ES for the last 5 days, 7/29 - 7/23, that I have. In that order my numbers are: 975.25/965.25, 979.25/966, 980/969, 979/962.50, 976.50/950.75. Adding those up and dividing by 5 gave me 15.3...not the 13.3 that shows up on my chart. So, I checked further in Ensign and found that it calculates the ATR as an exponential moving average, as opposed to a simple moving average. Does TS calculate ATR as a SMA or EMA? Maybe that's the difference.
We have different data feeds, so things may be different due to that, and just to confirm, I only look at RTH numbers trading from 9:30 to 4:15 on ES & NQ. Let's start by comparing the High's & Lows on ES for the last 5 days, 7/29 - 7/23, that I have. In that order my numbers are: 975.25/965.25, 979.25/966, 980/969, 979/962.50, 976.50/950.75. Adding those up and dividing by 5 gave me 15.3...not the 13.3 that shows up on my chart. So, I checked further in Ensign and found that it calculates the ATR as an exponential moving average, as opposed to a simple moving average. Does TS calculate ATR as a SMA or EMA? Maybe that's the difference.
JB
jbux
Rep: 0
Posts: 18
PaulR,
I agree with all of your High Lows for the last 5 days.
Also, I can duplicate your ATR using this formula:
ATR = XAverage(ATR(ATRLength),AvgLength)
ATRLength is 1
AvgLength is 5 (to compute XAvg)
My ATR's for the last 5 days :
7/29 13.29
7/28 14.81
7/27 15.34
7/24 17.51
7/23 18.01
Does this make any sense ?
What are your settings for the ATR ?
John
I agree with all of your High Lows for the last 5 days.
Also, I can duplicate your ATR using this formula:
ATR = XAverage(ATR(ATRLength),AvgLength)
ATRLength is 1
AvgLength is 5 (to compute XAvg)
My ATR's for the last 5 days :
7/29 13.29
7/28 14.81
7/27 15.34
7/24 17.51
7/23 18.01
Does this make any sense ?
What are your settings for the ATR ?
John