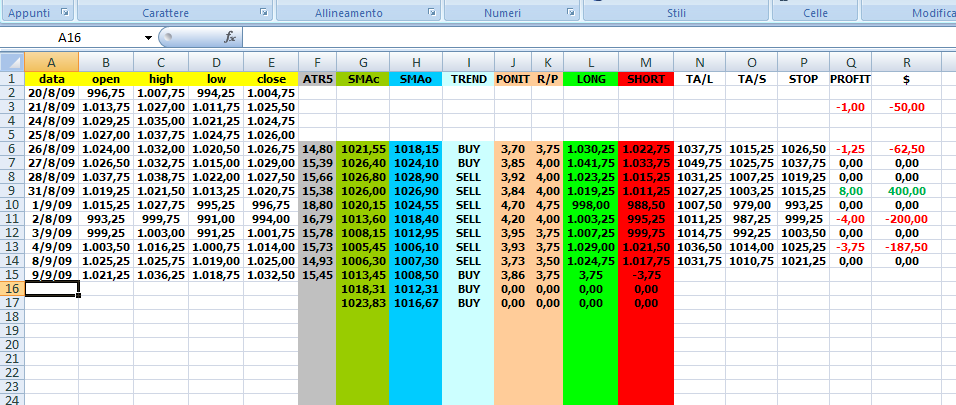
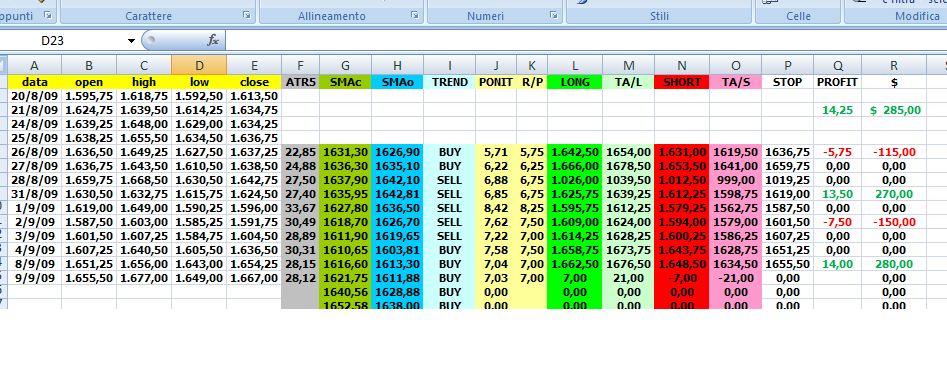
Wanted to offer the following in the hope that others might review with a constructive eye and, perhaps, conduct additonal backtesting. My technical abilities are limited, so I backtest manually.
The results for the 28 trading days between Apr 2 - May 12 on NQ June show 19 trades. 13 W 164 points 5L 29.75 points 1 BE. Gross of 134.25 points - $2685 before commission
Methodology
Chart set up: On a day session chart plot the 5 period average true range. Also plot a 5 period simple moving average of both the close and the open. Longs are taken only when the 5 period SMA of the close is above the 5 period SMA of the open. Shorts only when below.
Entries and Exits: If taking longs, add 50% of yesterday's ATR to today's open. This is the entry. Exits are either - a stop order at today's open, limit order at 50% of yesterday's ATR added to today's open, or MOC. For shorts simply reverse.
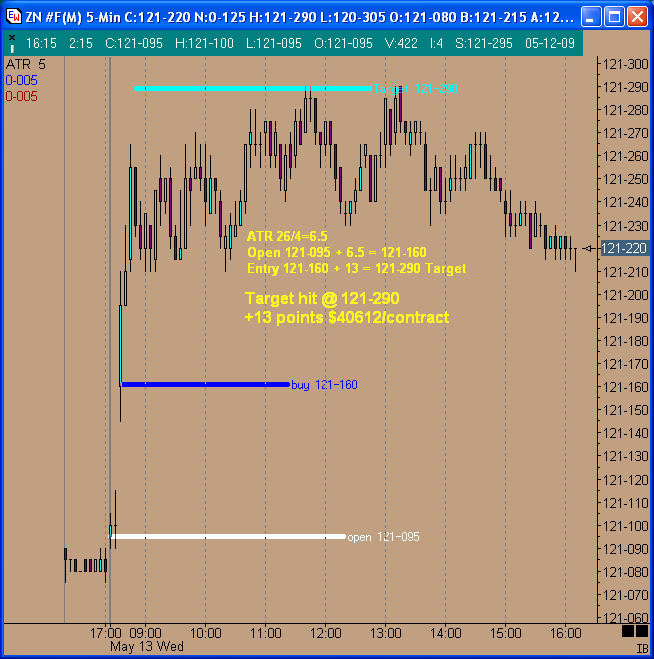
Having a target that is twice the stop really helped when I manually tested this for the same period as above on the 10 yr note (ZN June). 18 trades were taken. 8 W 83.5 points 10 L 47.5 points Gross of 36.5 points - $1140.62 before commission.
Thanks in advance for your constructive ideas for improvement and any additional backtesting you might undertake.
edit - 25% atr changed to 50%
PA
PaulR
Rep: 130
Posts: 119
You're welcome Ninja.
Seems like every time I stumble onto something it works for a while. Then it turns to "&^%$&(^%**&". LOL Hoping that's not the case here.
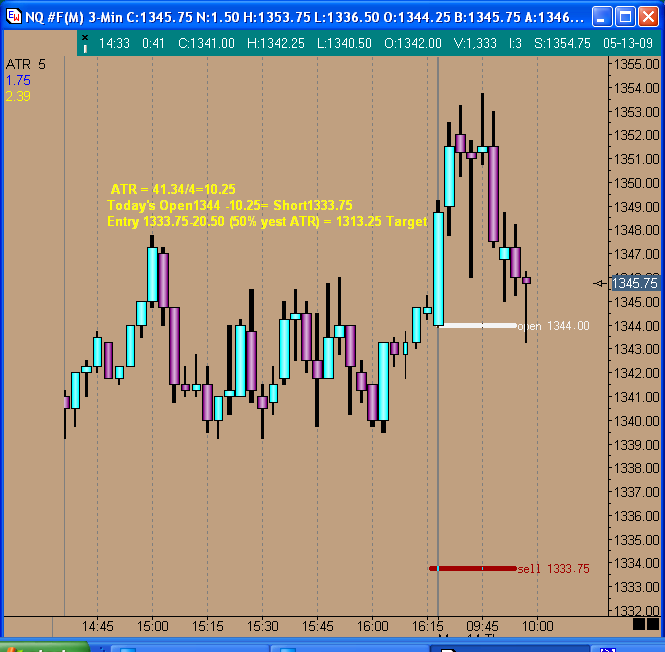
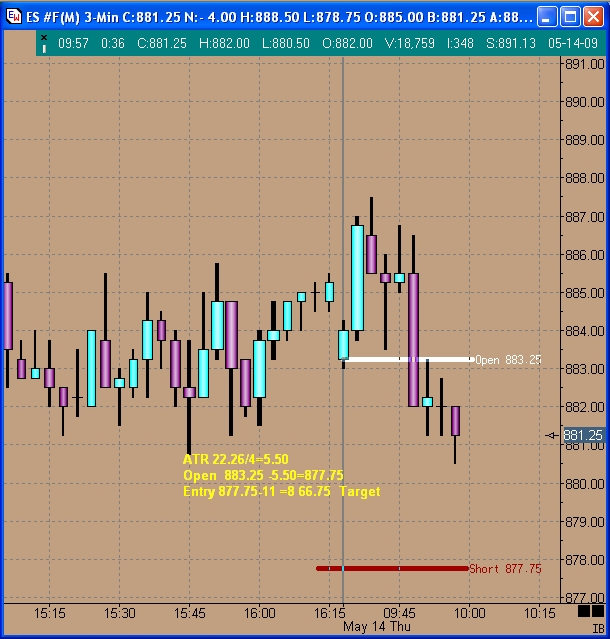
Here's how things started out today for NQ and ES.
Seems like every time I stumble onto something it works for a while. Then it turns to "&^%$&(^%**&". LOL Hoping that's not the case here.
Here's how things started out today for NQ and ES.
Click image for original size
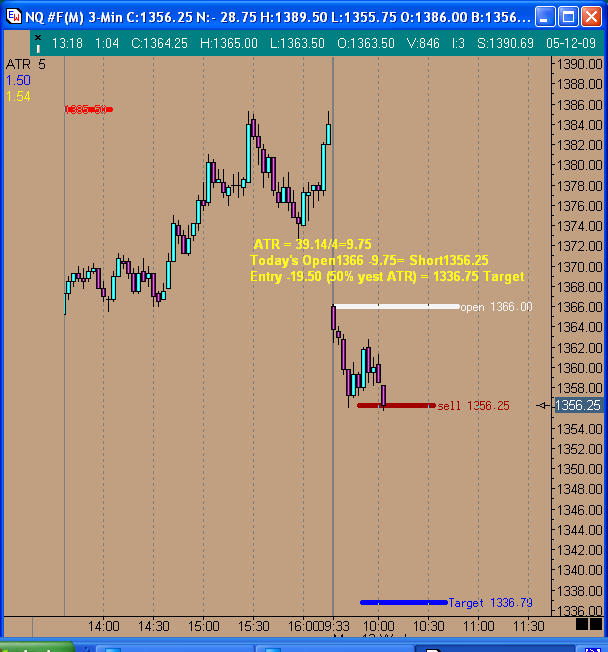
Click image for original size
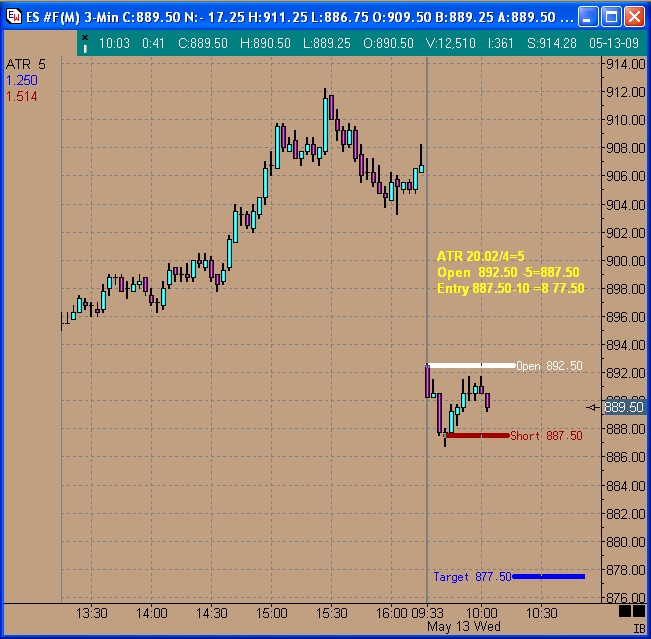
PA
PaulR
Rep: 130
Posts: 119
Here's how the 3 trades from my previous posts worked out.
Click image for original size

Click image for original size

Click image for original size
PA
PaulR
Rep: 130
Posts: 119
Here are the entry points today for NQ and ES.
Click image for original size
Click image for original size
PA
PaulR
Rep: 130
Posts: 119
Based on current ATR and today's open would go long on buy stop @ 121-285.Stop 121-230 and target of
122-075. Let's see what happens.
122-075. Let's see what happens.
PA
PaulR
Rep: 130
Posts: 119
Earlirt post was for ZN june. For NQ June sell stop @ 1345. Stop 1354. Target 1327. On ES June sell stop @ 884.25. Stop 889.25. Target 874.25.
PA
PaulR
Rep: 130
Posts: 119
ES was the only one that triggered. Target not hit. Exited at 4PM for +1.75 .